- Jul 2, 2022
- 385
- 4
BTCUSD Technical Analysis – 11th APR 2023

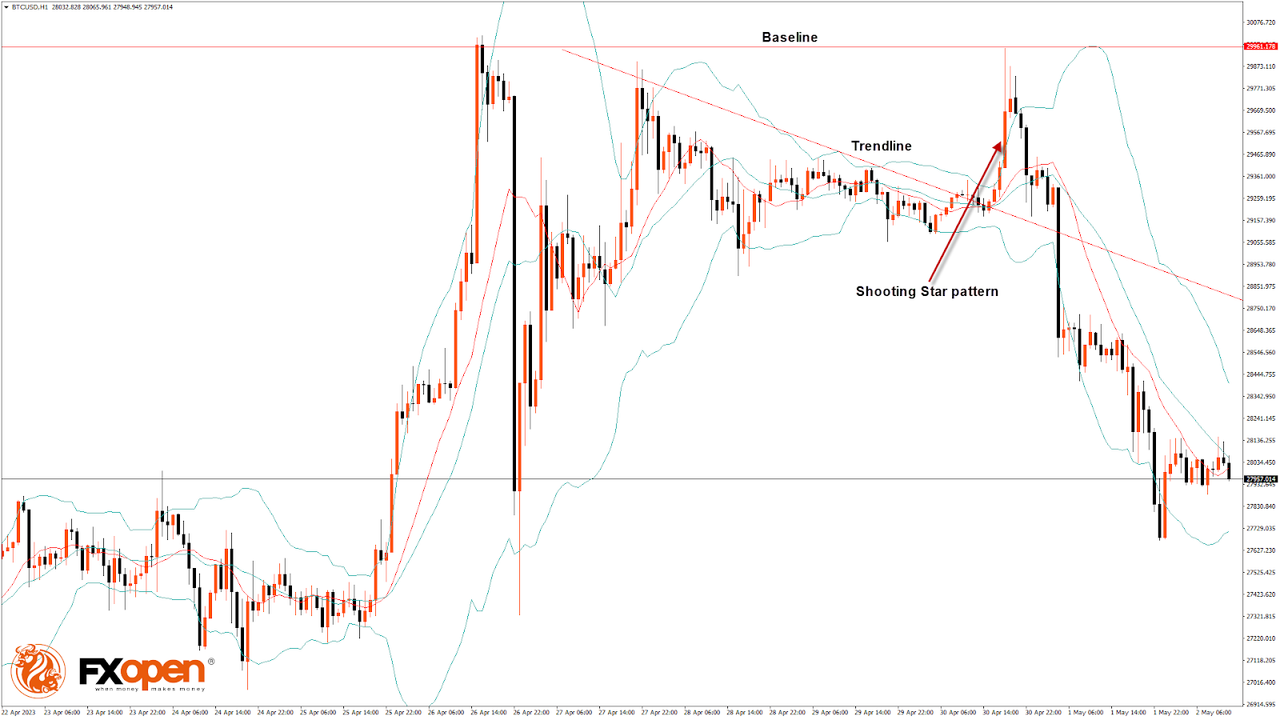
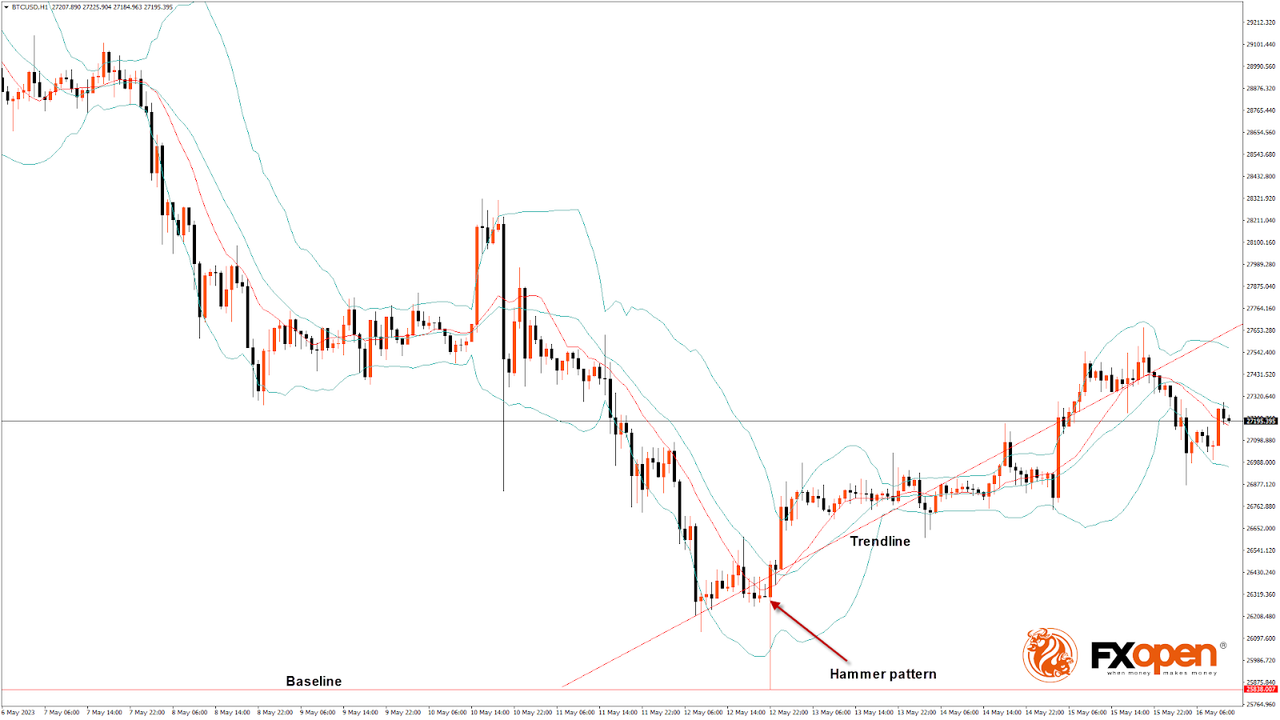
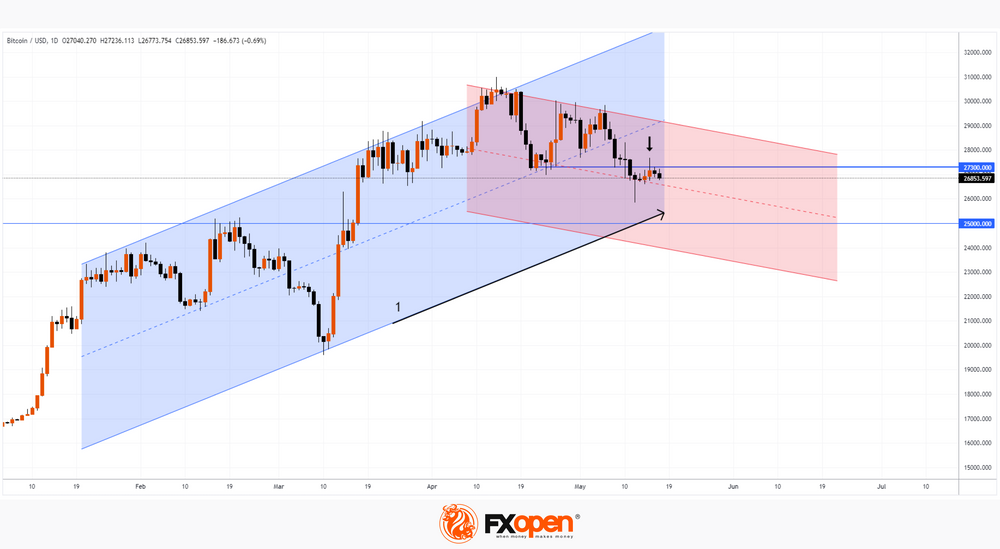
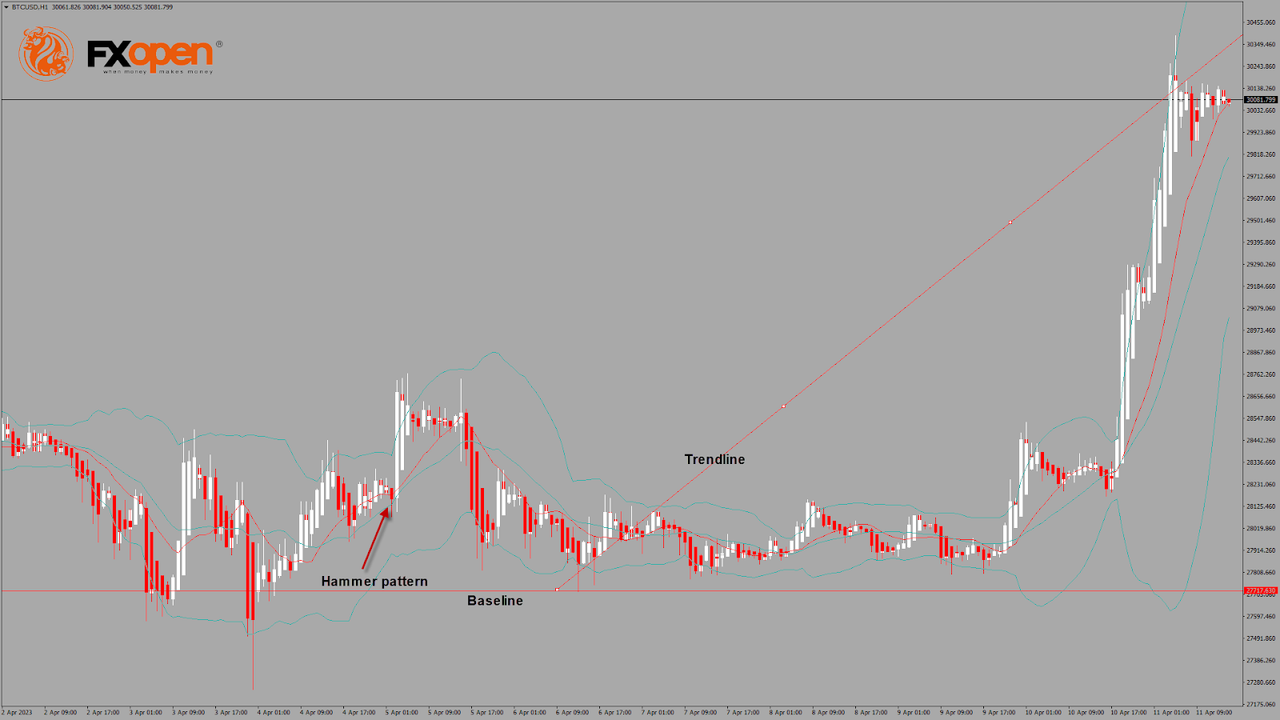
Bitcoin continues its bullish momentum from last week, and after touching a low of $27,717 on April 6, we can see a bull run, which managed to push the prices of BTCUSD above the $30,000 handle today in the early European trading session.
The resistance of the channel is broken in the daily timeframe, indicating the strength of the bulls.
We can clearly see a hammer pattern above the $27,717 handle.
Bitcoin continues to move in a range-bound motion between the $29,800 and $30,200 levels, which is indicative of a consolidation phase in the markets.
Both the STOCH and Williams Percent Range indicate overbought levels, which means that in the immediate short term, a decline in the price is expected.
The relative strength index is at 74.02, indicating a strong demand for Bitcoin and the continuation of the buying pressure in the markets.
Bitcoin is now moving above its 100-hour simple moving average and above its 200-hour exponential moving average.
Most of the major technical indicators are giving a bullish signal, which means that in the immediate short term, we are expecting targets of $31,000 and $32,500.
The average true range indicates low market volatility with strong bullish momentum.
VIEW FULL ANALYSIS VISIT - FXOpen Blog...
Disclaimer: This Forecast represents FXOpen Companies opinion only, it should not be construed as an offer, invitation or recommendation in respect to FXOpen Companies products and services or as Financial Advice.
XRPUSD Technical Analysis – 11th APR 2023

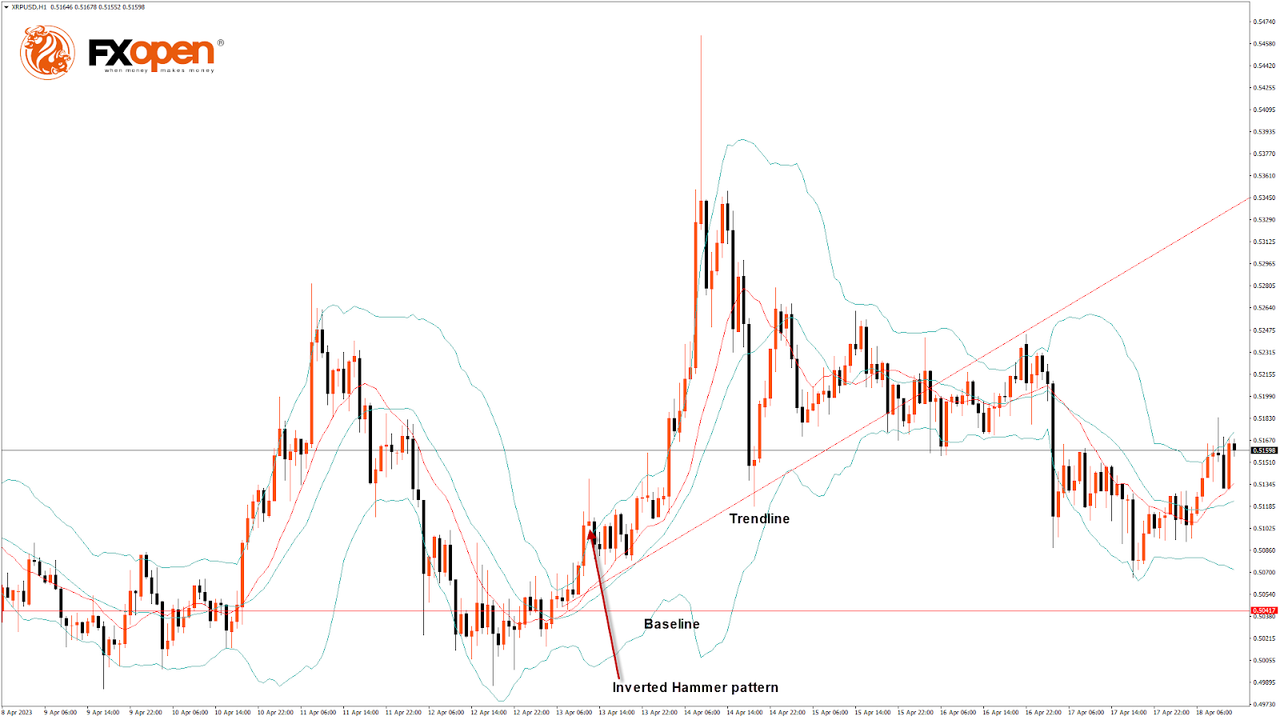
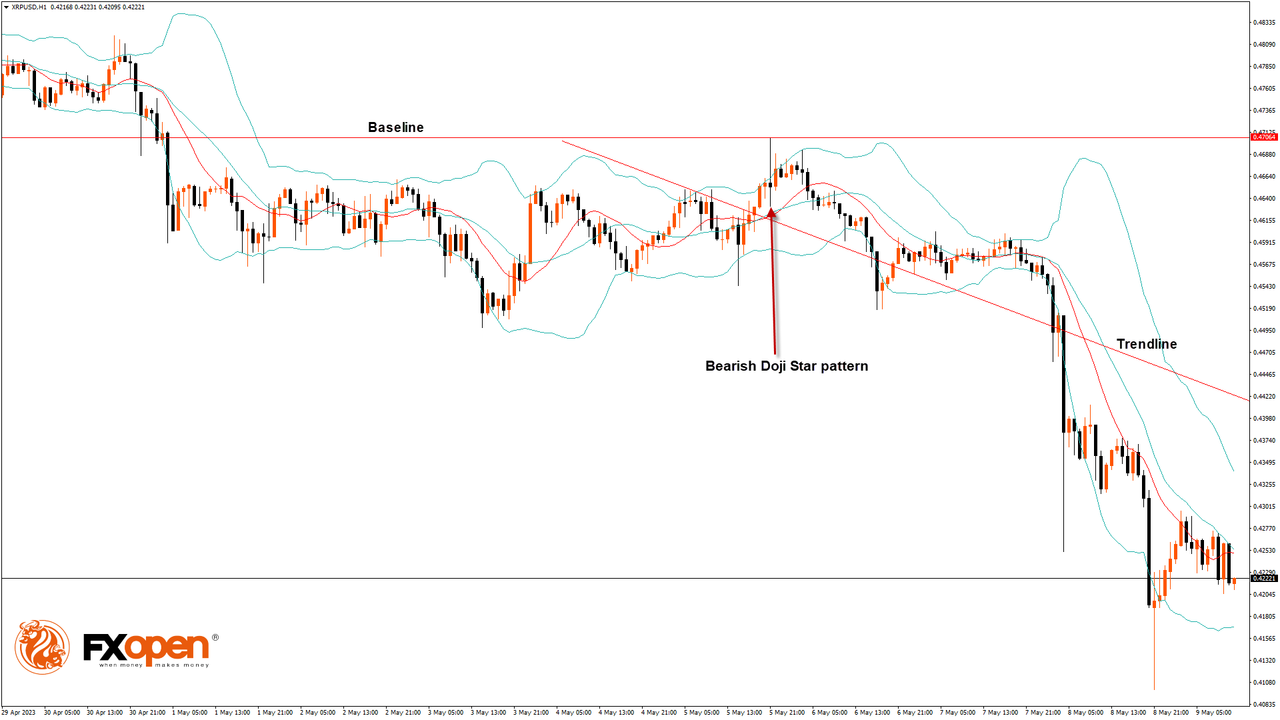
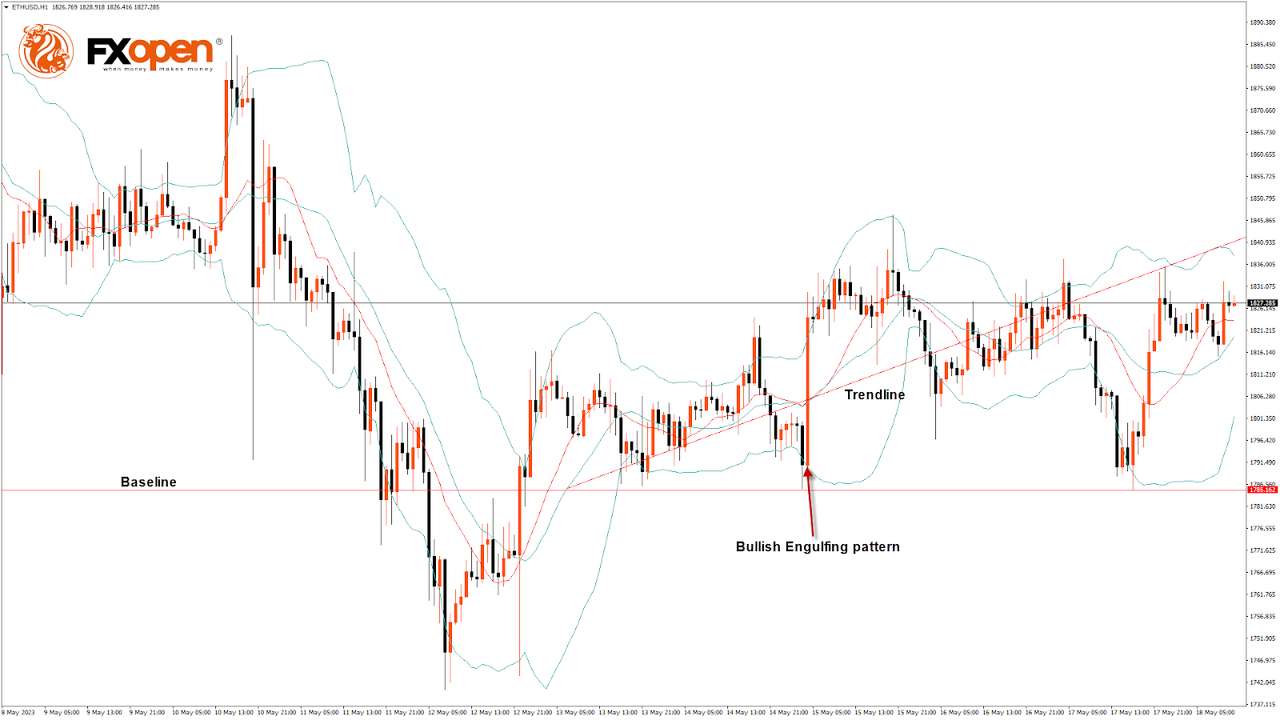
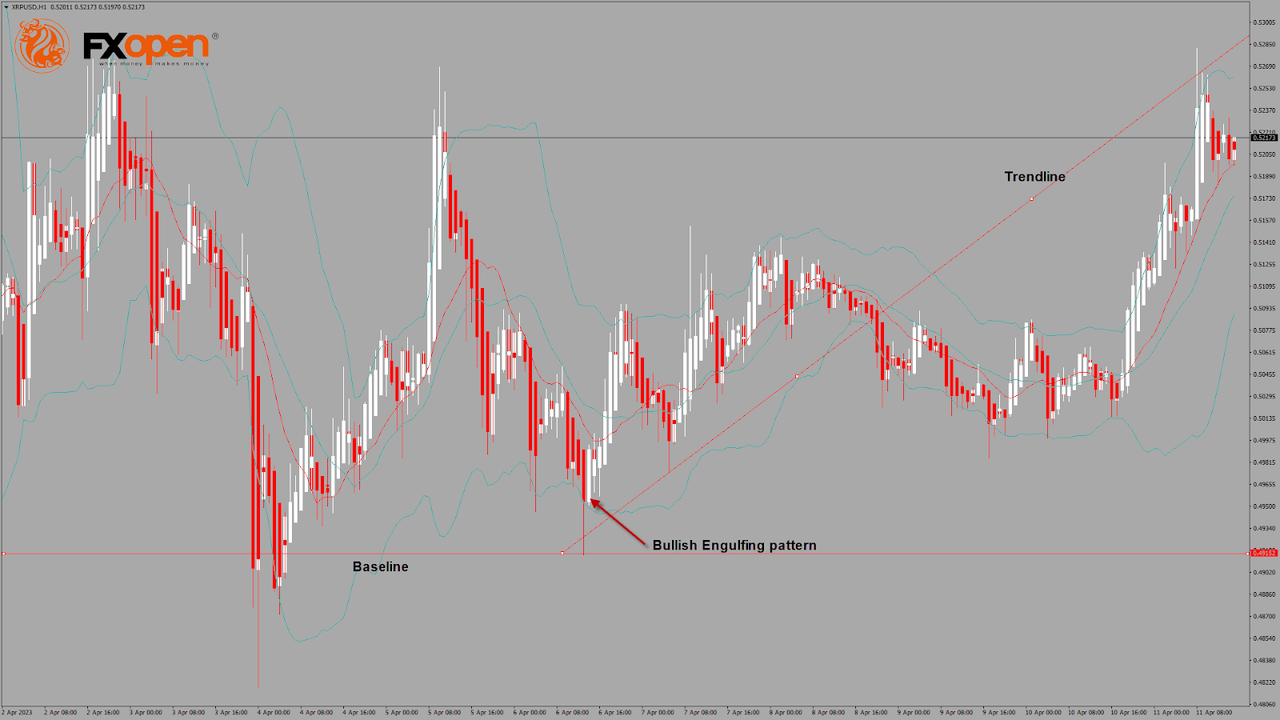
Last week, the market sentiment turned bullish after Ripple touched a low of $0.4915 on April 6 and started to correct. The market opened bullish this week.
On the hourly chart:
The relative strength index is at 60.40, which signifies a strong demand for Ripple at the current market prices and the continuation of the bullish phase in the market.
Moving averages signal an upward price movement at the current market level of 0.5203.
Both the STOCH and CCI are in the neutral zones, which means the price is now resting in the consolidation zone.
Ripple is now trading just below its pivot level of 0.5209 and is now facing its classic resistance at 0.5221 and Fibonacci resistance at 0.5241, after which it will be able to move towards 0.6000.
Some of the major technical indicators are bullish.
We have also detected a bullish price crossover with 20 and 50-period moving averages in the weekly timeframe.
VIEW FULL ANALYSIS VISIT - FXOpen Blog...
Disclaimer: This Forecast represents FXOpen Companies opinion only, it should not be construed as an offer, invitation or recommendation in respect to FXOpen Companies products and services or as Financial Advice.
Bitcoin continues its bullish momentum from last week, and after touching a low of $27,717 on April 6, we can see a bull run, which managed to push the prices of BTCUSD above the $30,000 handle today in the early European trading session.
The resistance of the channel is broken in the daily timeframe, indicating the strength of the bulls.
We can clearly see a hammer pattern above the $27,717 handle.
Bitcoin continues to move in a range-bound motion between the $29,800 and $30,200 levels, which is indicative of a consolidation phase in the markets.
Both the STOCH and Williams Percent Range indicate overbought levels, which means that in the immediate short term, a decline in the price is expected.
The relative strength index is at 74.02, indicating a strong demand for Bitcoin and the continuation of the buying pressure in the markets.
Bitcoin is now moving above its 100-hour simple moving average and above its 200-hour exponential moving average.
Most of the major technical indicators are giving a bullish signal, which means that in the immediate short term, we are expecting targets of $31,000 and $32,500.
The average true range indicates low market volatility with strong bullish momentum.
- Bitcoin bullish continuation is seen above $27,717.
- The RSI remains above 50, indicating a bullish market.
- The price is now trading above its pivot level of $30,088.
- The short-term range is strongly bullish.
- Some major technical indicators signal that the price may move to $30,500 and $31,000 soon.
VIEW FULL ANALYSIS VISIT - FXOpen Blog...
Disclaimer: This Forecast represents FXOpen Companies opinion only, it should not be construed as an offer, invitation or recommendation in respect to FXOpen Companies products and services or as Financial Advice.
Post automatically merged:
XRPUSD Technical Analysis – 11th APR 2023
Last week, the market sentiment turned bullish after Ripple touched a low of $0.4915 on April 6 and started to correct. The market opened bullish this week.
On the hourly chart:
The relative strength index is at 60.40, which signifies a strong demand for Ripple at the current market prices and the continuation of the bullish phase in the market.
Moving averages signal an upward price movement at the current market level of 0.5203.
Both the STOCH and CCI are in the neutral zones, which means the price is now resting in the consolidation zone.
Ripple is now trading just below its pivot level of 0.5209 and is now facing its classic resistance at 0.5221 and Fibonacci resistance at 0.5241, after which it will be able to move towards 0.6000.
Some of the major technical indicators are bullish.
- Ripple bullish reversal is seen above 0.4915.
- The price is below its pivot level.
- Average true range indicates HIGH volatility.
We have also detected a bullish price crossover with 20 and 50-period moving averages in the weekly timeframe.
VIEW FULL ANALYSIS VISIT - FXOpen Blog...
Disclaimer: This Forecast represents FXOpen Companies opinion only, it should not be construed as an offer, invitation or recommendation in respect to FXOpen Companies products and services or as Financial Advice.