Disclaimer: This forecast represents FXOpen Companies opinion only, it should not be construed as an offer, invitation or recommendation in respect to FXOpen Companies products and services or as financial advice.
Crypto winter giving way to Crypto spring? Bitcoin suddenly wakes up
The long, drawn-out period which has lasted several months in which Bitcoin, previously as volatile as a piece of magnesium ribbon over a naked flame, has been utterly stagnant.
The days of $60,000 values and cliffhanger tweets by influencers suddenly crashing and inflating the value of the world's most valuable cryptocurrency seem a distant memory.
If 2021 was the year of the Bitcoin-related rollercoaster ride, 2022 has been a year of absolute hibernation, representing a contrast so great that it is hard to imagine that it is the same investment vehicle.
The doldrums which have existed for a few months now have been dubbed 'crypto winter' by analysts and journalists, a term used to depict the low values and lack of market movement which has overshadowed the previous enthuaiasm for Bitcoin trading.
Today, however, during the Asian session, Bitcoin suddenly rose in value by a substantial amount, to $21,382 by 2.25am UK time.
On Thursday last week, Bitcoin was languishing at $18,880 therefore the rise over just 3 working days has been over $2,000.
As the price of Bitcoin headed toward the $20,000 mark at the beginning of this week, the total cryptocurrency market capitalization figure began to approach £1 trillion.
This is the first time that Bitcoin has passed the $20,000 mark since before the collapse of cryptocurrency exchange FTX in November.
Last week, cryptocurrencies began to rise in value, with Ethereum, the world's second most popular cryptocurrency, having also increased its capitalization leading to a speculation among some analysts that the crypto winter may be over and some degree of resurgence is beginning.
Of course, these small increases are a far cry from the huge surges in value experienced in 2021, but they are significant when considering the totally flat values that have been in place for a few months.
Crypto-denominated stocks are also on the up, largely due to the sudden bullish approach to cryptocurrencies that has come about, and some pundits are considering that the lingering issue of continued inflation among centrally issued currencies and centralized economies dogged by recessions and rising costs are waking up the prices of cryptocurrencies as people look toward another year of high costs and depreciating fiat currencies and search for alternatives.
These opinions all amount to guesswork, however, but what is for sure is that there is a definitive sudden interest in cryptocurrencies once again and that is clearly demonstrated by looking at the chart patterns this morning.
Disclaimer: This Forecast represents FXOpen Companies opinion only, it should not be construed as an offer, invitation or recommendation in respect to FXOpen Companies products and services or as Financial Advice.
BTCUSD and XRPUSD Technical Analysis – 17th JAN 2023
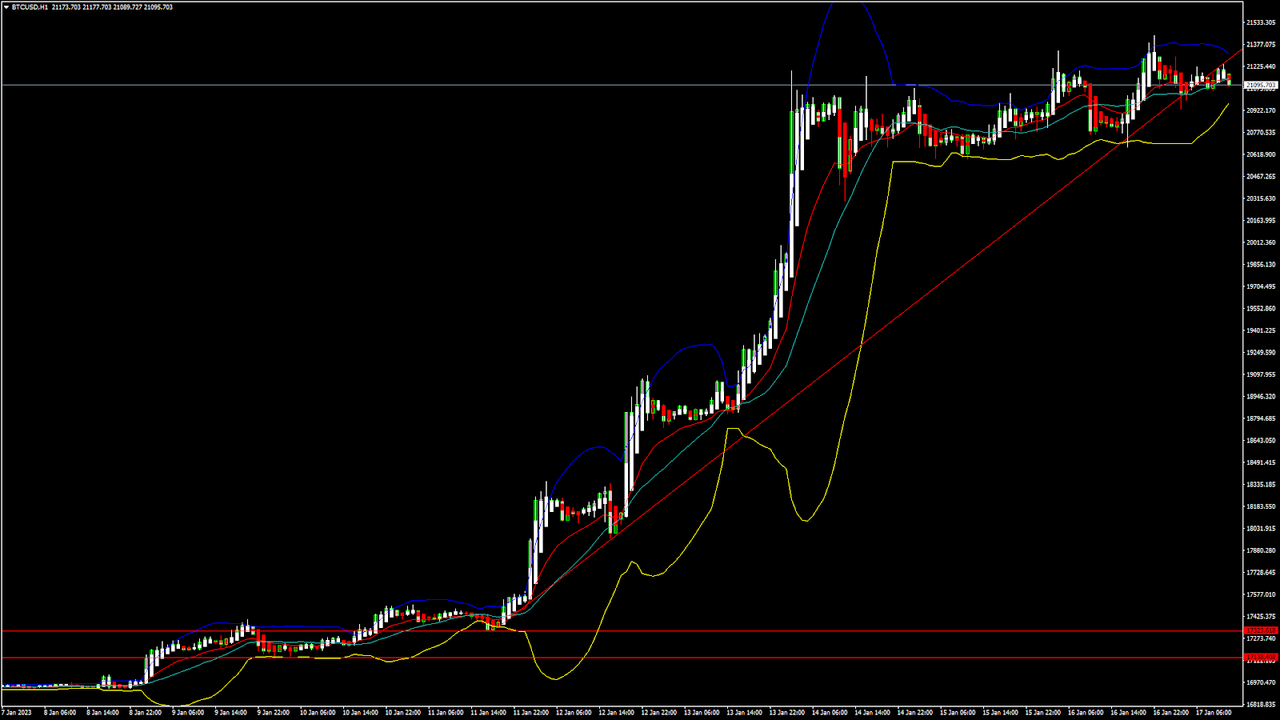
BTCUSD: Three Inside Up Pattern Above $17323
Bitcoin continues its bullish momentum from last week and after touching a low of $17323 on 11th Jan, the price started to correct upwards against the US Dollar and is now ranging above the $21000 handle in the European trading session today.
We can see an upwards rally in the BTCUSD which managed to touch the level of $21390 on 16th Jan.
We can clearly see a three inside up pattern above the $17323 handle which is a bullish reversal pattern because it signifies the end of a downtrend and a shift towards an uptrend.
Bitcoin touched an intraday high of 21288 and an intraday low of 20952 in the Asian trading session today.
The price of bitcoin is ranging near a new record high of 1 month.
The ichimoku is indicating a bullish crossover with tenkan and kijun in the 30-minute time frame.
Both the STOCH and Williams percent range are indicating overbought levels which means that in the immediate short term, a decline in the prices is expected.
The resistance of the channel is broken in the 15-minute time frame indicating bullish trends.
The relative strength index is at 72.09 indicating a very strong demand for bitcoin, and the continuation of the buying pressure in the markets.
Bitcoin is now moving above its 100 hourly simple moving average and above its 100 hourly exponential moving averages.
Most of the major technical indicators are giving a buy signal, which means that in the immediate short term, we are expecting targets of 22000 and 23500.
The average true range is indicating less market volatility with a strong bullish momentum.
Bitcoin: bullish continuation seen above $17323
The STOCHRSI is indicating an OVERSOLD level
The price is now trading just below its pivot level of $21167
The short term range is strongly bullish
Bitcoin: Bullish Continuation Seen Above $17323
The price of Bitcoin witnessed a rally after crossing the $18000 levels, and now we can see some market consolidation above the $21000 levels.
After the consolidation phase is over, we are expecting upside moves in the range of $22000 to $24000 levels.
There is an ascending channel forming with the current support at $17379 which is a 14-3 day raw stochastic at 20%.
We can see the formation of a bullish trend reversal pattern with the adaptive moving average AMA20 in the 15-minute time frame.
The immediate short-term outlook for bitcoin is strongly bullish, the medium-term outlook has turned bullish, and the long-term outlook remains neutral under present market conditions.
Bitcoin’s support zone is located at $18865 which is a 50% retracement from a 4-week high/low and at $19892 which is a 14-3 day raw stochastic at 70%.
The price of BTCUSD is now facing its classic resistance level of 21263 and Fibonacci resistance level of 21320 after which the path towards 22000 will get cleared.
In the last 24hrs BTCUSD has increased by 1.28% by 266.18$ and has a 24hr trading volume of USD 22.330 billion. We can see a decrease of 4.90% in the trading volume compared to yesterday, which appears to be normal.
The Week Ahead
Bitcoin’s price rocketed higher recently and moved to a 2-month high crossing the $21000 levels. We are now looking for the next upwards move towards the $22000 and $24000 levels.
The daily RSI is printing at 86.91 which indicates a very STRONG demand for bitcoin and the continuation of the bullish phase present in the markets in the short-term range.
We can see the formation of a bullish trend line from $17323 towards the $21324 level.
The price of BTCUSD is now facing its resistance zone located at $21466 which is a 13-week high and $22981 which is a 3-10 day MACD oscillator stalls.
The weekly outlook is projected at $23000 with a consolidation zone of $22000.
Technical Indicators:
The MACD (12,26): is at 689.90 indicating a BUY
The commodity channel index, CCI (14): is at 86.32 indicating a BUY
The rate of price change, ROC: is at 1.60 indicating a BUY
Bull/bear power (13): is at 593.30 indicating a BUY
Disclaimer: This Forecast represents FXOpen Companies opinion only, it should not be construed as an offer, invitation or recommendation in respect to FXOpen Companies products and services or as Financial Advice.
ETHUSD and LTCUSD Technical Analysis – 19th JAN, 2023
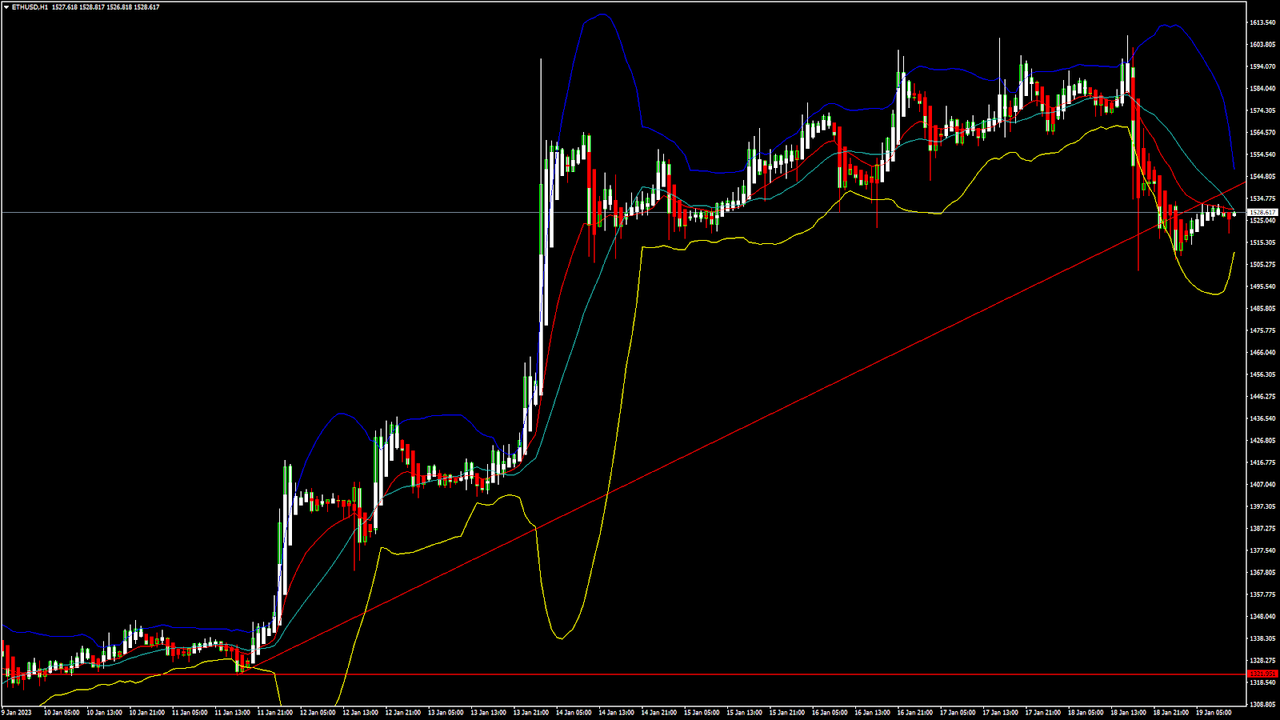
ETHUSD: Double Bottom Pattern Above $1321
Ethereum was unable to sustain its bearish momentum and after touching a low of 1321 on 11th Jan, the price started to correct upwards against the US dollar crossing the $1600 handle on 18th Jan.
The prices are ranging near horizontal support in the daily time frame indicating bullish trends.
We can clearly see a double bottom pattern above the $1321 handle which is a bullish pattern and signifies the end of a bearish phase and the start of a bullish phase in the markets.
ETH is now trading just below its pivot level of 1540 and moving in a mildly bullish channel. The price of ETHUSD is now testing its classic resistance level of 1575 and Fibonacci resistance level of 1639 after which the path towards 1700 will get cleared.
We have also seen the formation of a bullish harami pattern in the 15-minute time frame.
The relative strength index is at 72.46 indicating a STRONG demand for Ether and the continuation of the buying pressure in the markets.
Both the STOCH and average directional index are indicating an overbought market, which means that the prices are expected to decline in the short-term range.
Most of the technical indicators are giving a STRONG BUY market signal.
Most of the moving averages are giving a STRONG BUY signal at the current market levels of $1528.
ETH is now trading above both the 100 hourly simple and 100 hourly exponential moving averages.
Ether: bullish reversal seen above the $1321 mark
The short-term range appears to be mildly bullish
ETH continues to remain above the $1500 level
The average true range is indicating HIGH market volatility
Ether: Bullish Reversal Seen Above $1321
ETHUSD continues to trade higher against the US dollar and bitcoin. The price of Ethereum remains supported above the $1500 level and now we are testing the break of the $1600 handle.
We can see the formation of a bullish price crossover pattern with the adaptive moving average AMA20 in the daily time frame.
We have also detected a bullish Doji star pattern in the 1-hour time frame.
ETHUSD touched an intraday low of 1507 in the Asian Trading session and an intraday high of 1531 in the European trading session today.
The STOCHRSI is indicating a NEUTRAL level.
The key support levels to watch are $1432 which is a 38.2% Retracement from a 4-week high, and $1446 at which the price crosses 9-Day Moving Average.
ETH has decreased by 3.18% with a price change of 50.14$ in the past 24hrs and has a trading volume of 10.105 billion USD.
We can see an Increase 33.87% in the total trading volume in the last 24 hrs which appears to be normal.
The Week Ahead
ETH has already made a successful attempt at crossing the $1600 level and the next targets are located at $1700 and $1800 in the medium-term.
At present, the price is moving in a consolidation channel above the $1500 level.
We can see the formation of a bullish ascending channel from $1321 towards the $1542 level.
The immediate short-term outlook for Ether has turned mildly bullish, the medium-term outlook has turned bullish, and the long-term outlook for Ether is neutral under present market conditions.
The resistance zone is located at $1588 which is a pivot point 1st resistance point and at $1618 which is a 3-10 day MACD oscillator stalls.
The weekly outlook is projected at $1700 with a consolidation zone of $1650.
Technical Indicators:
The relative strength index, RSI (14): is at 72.46 indicating a BUY
The moving average convergence divergence, MACD (12,26): is at 79.85 indicating a BUY
The ultimate oscillator: is at 60.41 indicating a BUY
The rate of price change, ROC: is at 22.11 indicating a BUY
Disclaimer: This Forecast represents FXOpen Companies opinion only, it should not be construed as an offer, invitation or recommendation in respect to FXOpen Companies products and services or as Financial Advice.
Disclaimer: This forecast represents FXOpen Companies opinion only, it should not be construed as an offer, invitation or recommendation in respect to FXOpen Companies products and services or as financial advice.
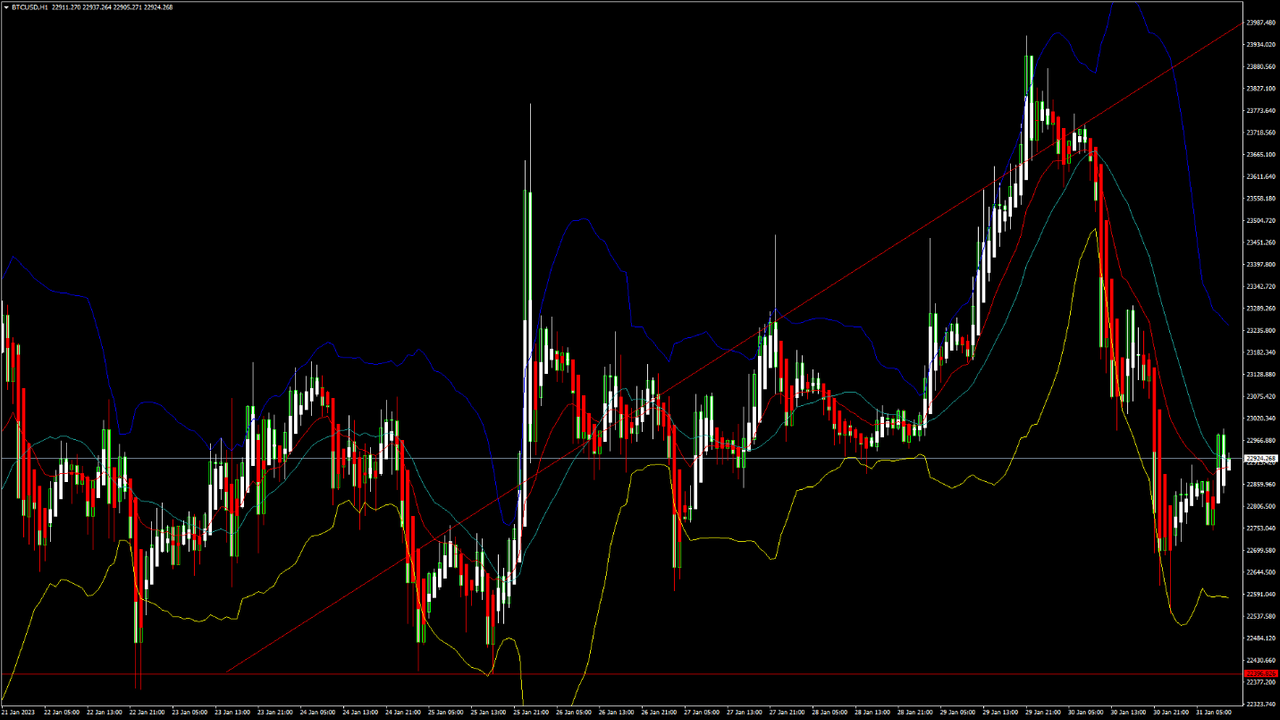
BTCUSD and XRPUSD Technical Analysis – 24th JAN 2023
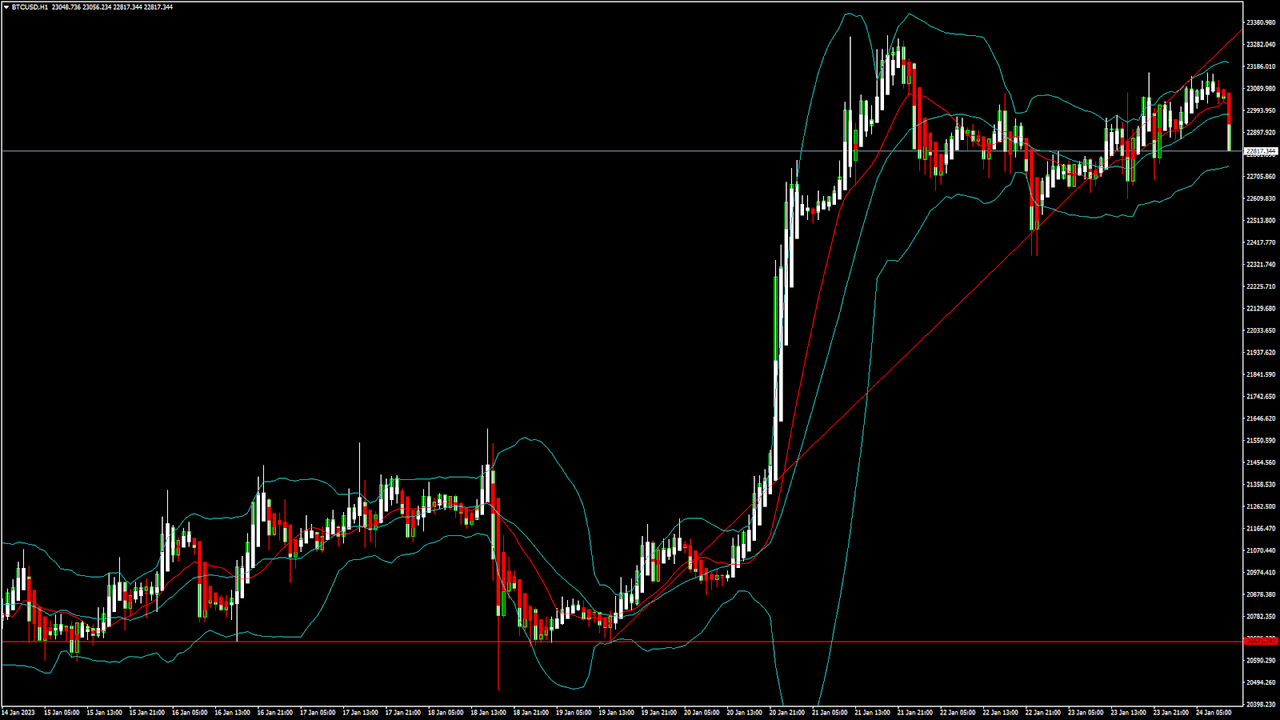
BTCUSD: Inverted Hammer Pattern Above $20671
Bitcoin continues its bullish momentum from last week and after touching a low of $20671on 19th Jan we can see a bull run which managed to push the prices of BTCUSD above the $23000 handle today in the early Asian trading session.
After touching a high of $23159 we can see that the prices are declining due to profit taking by the medium term investors.
The price of bitcoin is ranging near a new record high of 1 month.
We can clearly see an inverted hammer pattern above the $20671 handle which is a bullish reversal pattern because it signifies the end of a downtrend and a shift towards an uptrend.
Bitcoin touched an intraday high of 23159 in the Asian trading session and an intraday low of 22858 in the European trading session today.
Both the STOCH and Williams percent range are indicating overbought levels which means that in the immediate short term, a decline in the prices is expected.
The relative strength index is at 63.63 indicating a strong demand for bitcoin, and the continuation of the buying pressure in the markets.
Bitcoin is now moving above its 100 hourly exponential moving average and above its 200 hourly exponential moving average.
Most of the major technical indicators are giving a strong buy signal, which means that in the immediate short term, we are expecting targets of 23000 and 24500.
The average true range is indicating less market volatility with a strongly bullish momentum.
Bitcoin: bullish continuation seen above $20671
The STOCHRSI range is indicating oversold levels
The price is now trading below its pivot level of $23066
All of the moving averages are giving a STRONG BUY market signal
Bitcoin: Bullish Continuation Seen Above $20671
We can now see that the price of Bitcoin is moving in a correction phase after which the market consolidation will start above the $22500 handle.
The Aroon indicator is giving a bullish trend in the 1-hour time frame.
The momentum indicator is back over zero in the 30-minute time frame.
We can see the formation of the bullish harami cross pattern in the 15-minute time frame indicating bullish trends.
We have also detected a bullish price crossover pattern with the adaptive moving average AMA100 in the 15-minute time frame.
The immediate short-term outlook for bitcoin is strongly bullish, the medium-term outlook has turned bullish, and the long-term outlook remains neutral under present market conditions.
Bitcoin’s support zones are located at $21017 at which the price crosses 9-day moving average, and at $21976 which is a 14-3 day raw stochastic at 80%.
The price of BTCUSD is now facing its classic resistance level of 23200 and Fibonacci resistance level of 23288 after which the path towards 24000 will get cleared.
In the last 24hrs BTCUSD has increased by 0.47% by 107$ and has a 24hr trading volume of USD 27.839 billion. We can see an increase of 15.92% in the trading volume compared to yesterday, which is due to the heavy buying pressure seen in the global markets.
The Week Ahead
The price of bitcoin has already entered into a super bullish zone above the $22000 and further upsides are located at $24000 and $25000 in the medium-term.
Bitcoin’s resistance zone is located at $23309 which is a 13-week high and at $24778 which is a 3-10 day MACD oscillator stalls.
There is an ascending channel forming with the current support located at $19977 which is a 14-3 day raw stochastic at 50%.
The weekly outlook is projected at $24500 with a consolidation zone of $24000.
Technical Indicators:
The moving averages convergence divergence, MACD (12, 26): is at 359.30 indicating a BUY
The commodity channel index, CCI (14): is at 56.65 indicating a BUY
The relative strength index, RSI (14): is at 63.63 indicating a BUY
Bull/bear power (13): is at 594.12 indicating a BUY
Disclaimer: This Forecast represents FXOpen Companies opinion only, it should not be construed as an offer, invitation or recommendation in respect to FXOpen Companies products and services or as Financial Advice.
ETHUSD and LTCUSD Technical Analysis – 26th JAN, 2023
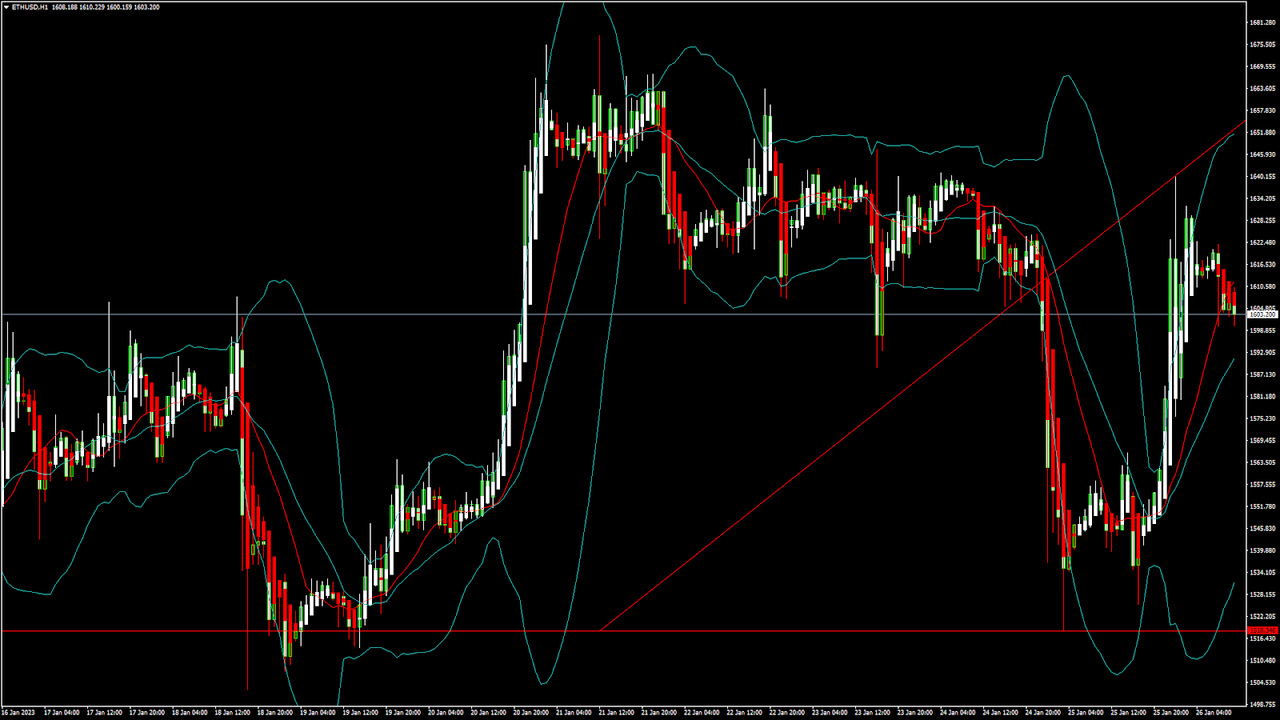
ETHUSD: Three Inside Up Pattern Above $1518
Ethereum was unable to sustain its bearish momentum and after touching a low of 1518 on 25th Jan, the price started to correct upwards against the US dollar crossing the $1600 handle today in the European trading session.
We have seen a bullish opening of the markets this week.
We can clearly see a three inside up pattern above the $1518 handle which is a bullish pattern and signifies the end of a bearish phase and the start of a bullish phase in the markets.
ETH is now trading just below its pivot level of 1607 and moving into a mildly bullish channel. The price of ETHUSD is now testing its classic resistance level of 1610 and Fibonacci resistance level of 1613 after which the path towards 1700 will get cleared.
The relative strength index is at 56.75 indicating a STRONG demand for Ether and the continuation of the bullish phase in the markets.
The price of Ethereum is ranging near the horizontal support in the 1-hour time frame indicating bullish trends.
Both the STOCH and CCI are indicating a neutral market, which means that the prices are expected to remain in a consolidation phase.
Most of the technical indicators are giving a BUY market signal.
Most of the moving averages are giving a BUY signal and we are now looking at the levels of $1650 to $1700 in the short-term range.
ETH is now trading above both the 100 & 200 hourly simple and exponential moving averages.
Ether: bullish reversal seen above the $1518 mark
The short-term range appears to be mildly bullish
ETH continues to remain above the $1600 level
The average true range is indicating LESS market volatility
Ether: Bullish Reversal Seen Above $1518
ETHUSD is now moving into a mildly bullish channel with the price trading above the $1600 handle in the European trading session today.
ETH touched an intraday high of 1625 in the Asian trading session and an intraday low of 1600 in the European trading session today.
We can see the formation of a bullish price crossover pattern with adaptive moving average AMA20 in the 30-minute time frame.
The Aroon indicator is giving a bullish trend in the 4-hour time frame.
We have also detected the formation of moving average bullish crossovers: MA50 & MA100 in the daily time frame.
Ethereum’s price is rising sharply against the US dollar and nitcoin and is now eyeing to cross the $1700 level soon.
The daily RSI is printing at 65.97 indicating a STRONG demand for Ether in the medium-term range.
The key support levels to watch are $1489 which is a 38.2% Retracement from a 4-week high, and $1536 which is a 3-10-16 day MACD moving average stalls.
ETH has increased by 3.98% with a price change of 61.50$ in the past 24hrs and has a trading volume of 10.232 billion USD.
We can see an increase of 10.64% in the total trading volume in the last 24 hrs which appears to be normal.
The Week Ahead
ETH price continues to remain in a bullish zone against the US dollar and bitcoin. ETHUSD is expected to move higher towards the $11650 and $1700 levels this week.
On the upside we are now looking at the immediate targets of 1677 which is a 13-week high, and $1685 which is a pivot point 2nd level resistance.
The immediate short-term outlook for Ether has turned strongly bullish, the medium-term outlook has turned bullish, and the long-term outlook for Ether is neutral in present market conditions.
The price of ETHUSD will need to remain above the important support level of $1588 which is a pivot point.
The weekly outlook is projected at $1700 with a consolidation zone of $1650.
Technical Indicators:
The average directional index, ADX (14): is at 45.27 indicating a BUY
The rate of price change: is at 2.735 indicating a BUY
Bull/bear power (13): is at 7.52 indicating a BUY
The Williams percent range : is at -44.41 indicating a BUY
Disclaimer: This Forecast represents FXOpen Companies opinion only, it should not be construed as an offer, invitation or recommendation in respect to FXOpen Companies products and services or as Financial Advice.
Disclaimer: This forecast represents FXOpen Companies opinion only, it should not be construed as an offer, invitation or recommendation in respect to FXOpen Companies products and services or as financial advice.
Markets focus on Bitcoin as volatility takes it to 5-month high
The much publicized 'crypto winter' has been a long, drawn out period of relatively low values among major cryptocurrencies, lasting now for several months.
Along with the depressed values compared to the incredible volatility of 2021 which showed Bitcoin race to over $60,000 and below $20,000 and back again, there has been a stagnant market for long enough for those who were on the edge of their seat a just a year and a half ago to fall asleep during the winter of 2022.
This weekend, however, has caused some market participants to wake from the months-long slumber and begin to take note as Bitcoin values suddenly climbed to $23,900 by Sunday evening (UK market time).
That is almost $1000 higher than the value at which Bitcoin began the very same day, its value having been at $23,003 at 00.30 in the first half hour of the morning UK time.
Over the 24 hours until 12.00pm today UK time, Bitcoin had risen by 2% which is significant considering the millpond-like doldrums it has been in over the past few weeks.
This sudden rally was short lived, however, and by 13.00 UK time, Bitcoin values had descended to $23,100 which is a similar value to the pre-rally price on Sunday morning.
Whilst the return to the low $23,000 range may appear a damp squib to those who had become excited by the sudden upward direction which took place yesterday, the movement does at least demonstrate that some market volatility was present after a long period of stagnation, hence why this has been a talking point among many analysts and reporters over the past 24 hours.
What is of perhaps greater interest is that the high point reached yesterday evening put Bitcoin value at its highest point since August 12, 2022, when it traded at $24,412 and despite tailing off a bit during the course of today, Bitcoin is still at its second highest point in the last six months.
Therefore, whilst perhaps a small blip in the market value of the world's most popularly traded cryptocurrency may appear short lived, this is the highest value in the past five months, which is definitely something to write about.
Disclaimer: This Forecast represents FXOpen Companies opinion only, it should not be construed as an offer, invitation or recommendation in respect to FXOpen Companies products and services or as Financial Advice.
BTCUSD and XRPUSD Technical Analysis – 31st JAN 2023
BTCUSD: Double Bottom Pattern Above $22396
Bitcoin continues its bullish momentum from last week and after touching a low of $22396 on 25th Jan, the prices started to correct upwards against the US dollar and are now ranging above the $22500 handle in the European trading session today.
We have seen a bullish opening of the markets this week.
We can clearly see a double bottom pattern above the $22396 handle which is a bullish reversal pattern because it signifies the end of a downtrend and a shift towards an uptrend.
Bitcoin touched an intraday low of 22543 in the Asian trading session and an intraday high of 22992 in the European trading session today.
The price of bitcoin is ranging near a new record high of 1 month.
We can see the formation of a bullish harami and bullish harami cross pattern in the daily time frame.
Both the STOCH and Williams percent range are indicating overbought levels which means that in the immediate short term, a decline in the prices is expected.
We have also detected a bullish doji star pattern in the 30-minute time frame indicating bullish trends.
The relative strength index is at 56.23 indicating a strong demand for bitcoin, and the continuation of the buying pressure in the markets.
Bitcoin is now moving below its 100 hourly simple moving average and above its 100 hourly exponential moving averages.
Most of the major technical indicators are giving a buy signal, which means that in the immediate short term, we are expecting targets of 23000 and 24500.
The average true range is indicating high market volatility with a mildly bullish momentum.
Bitcoin: bullish continuation seen above $22396
The commodity channel index is indicating a neutral level
The price is now trading just below its pivot level of $22884
The short-term range is mildly bullish
Bitcoin: Bullish Continuation Seen Above $22396
The price of bitcoin witnessed a downwards correction after touching $23926 as the target of $24K was rejected by the bulls. Now the markets are ranging into a consolidation channel above the $22500 handle.
After the consolidation phase is over, we are expecting upside moves in the range of $23500 to $24000 levels.
The resistance of the channel is broken in the 15-minute time frame.
We can see the formation of a bullish trend reversal pattern with the moving average MA20 in the 15-minute time frame.
The immediate short-term outlook for bitcoin is mildly bullish, the medium-term outlook has turned bullish, and the long-term outlook remains neutral under present market conditions.
Bitcoin’s support zone is located at $20780 at which the price crosses 9-day moving average stalls, and at $21091 which is a 38.2% retracement from a 4-week high.
The price of BTCUSD is now facing its classic resistance level of 22928 and Fibonacci resistance level of 22950 after which the path towards 23000 will get cleared.
In the last 24hrs BTCUSD has decreased by 1.85% by 432.62$ and has a 24hr trading volume of USD 25.925 billion. We can see a decrease of 5.10% in the trading volume compared to yesterday, which appears to be normal.
The Week Ahead
Bitcoin has reached its highest level this month at $23956 which is a positive sign after the harsh crypto winter season seen last year.
The daily RSI is printing at 69.281 which indicates a very strong demand for bitcoin and the continuation of the bullish phase present in the markets in the short-term range.
We can see the formation of a bullish trend line from $22396 towards the $23983 level.
The price of BTCUSD is now facing its resistance zone located at $23098 which is a pivot point, and at $23527 which is a 3-10 day MACD oscillator stalls.
The weekly outlook is projected at $24000 with a consolidation zone of $23500.
Technical Indicators:
The moving averages convergence divergence (12,26): is at 1256.90 indicating a BUY
The ultimate oscillator: is at 52.29 indicating a BUY
The rate of price change : is at 8.37 indicating a BUY
Bull/bear power (13): is at 856.36 indicating a BUY
Disclaimer: This Forecast represents FXOpen Companies opinion only, it should not be construed as an offer, invitation or recommendation in respect to FXOpen Companies products and services or as Financial Advice.
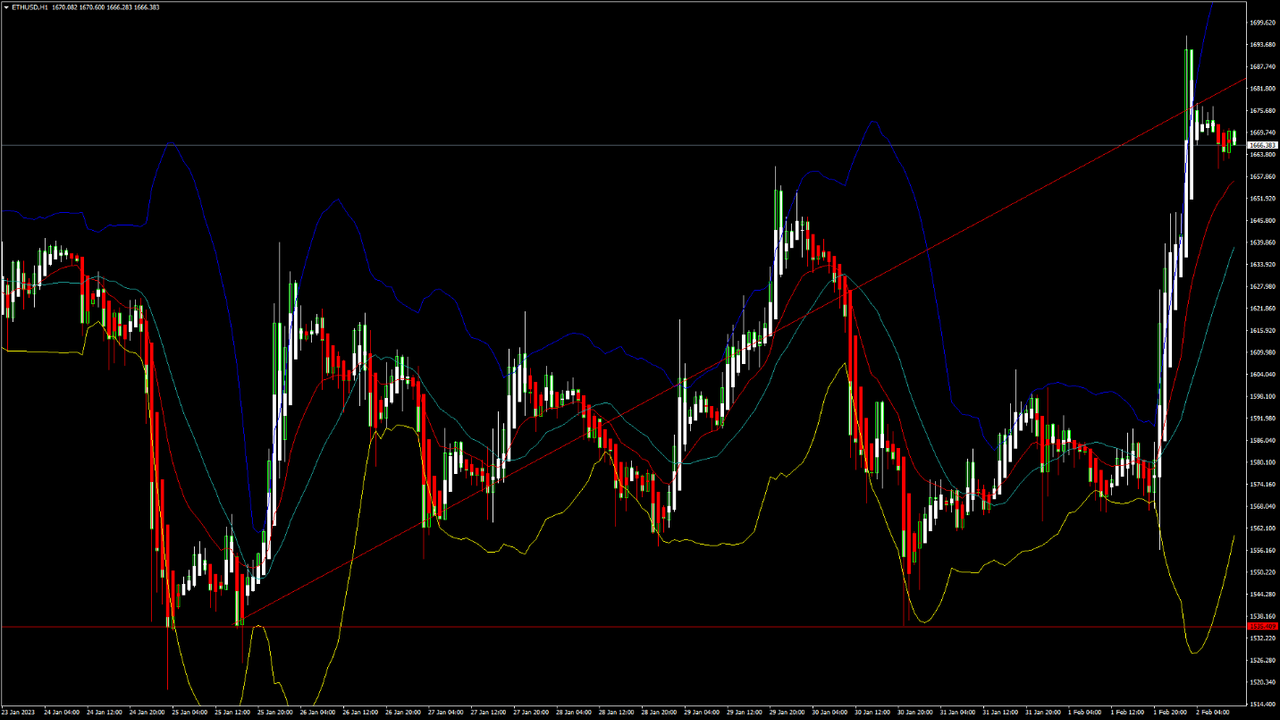
ETHUSD and LTCUSD Technical Analysis – 02nd FEB, 2023
ETHUSD: Three White Soldiers Pattern Above $1535
Ethereum was unable to sustain its bearish momentum and after touching a low of 1535 on 30th Jan, the price started to correct upwards against the US dollar crossing the $1650 handle today in the Asian trading session.
After touching a high of $1694 the prices have retracted due to profit taking by the medium-term investors.
We have seen a bullish opening of the markets this week.
We can clearly see a three white soldiers pattern above the $1535 handle which is a bullish pattern and signifies the end of a bearish phase and the start of a bullish phase in the markets.
ETH is now trading just below its pivot level of 1665 and moving into a strong bullish channel. The price of ETHUSD is now testing its classic resistance level of 1668 and Fibonacci resistance level of 1673 after which the path towards 1700 will get cleared.
We have also seen the formation of a Bullish engulfing line in the weekly time frame.
The price of Ethereum is ranging near the support of the channel in the 15-minute time frame indicating a bullish scenario.
The relative strength index is at 68.86 indicating a strong demand for Ether and the continuation of the buying pressure in the markets.
The Williams percent range is indicating an overbought market, which means that the price is expected to decline in the short-term range.
Most of the technical indicators are giving a strong buy market signal.
Most of the moving averages are giving a strong buy signal at the current market level of $1666.
ETH is now trading above both the 100 hourly simple and 100 hourly exponential moving averages.
Ether: bullish reversal seen above the $1535 mark
Short-term range appears to be strongly bullish
ETH continues to remain above the $1650 level
The average true range is indicating less market volatility
Ether: Bullish Reversal Seen Above $1535
ETHUSD continues to trade higher against the US dollar and bitcoin. The price of Ethereum remains supported above the $1600 level and now we are testing the break of the $1700 handle.
We can see the formation of a B=bullish price crossover pattern with adaptive moving average AMA20 in the weekly time frame.
The momentum indicator is back over zero in the daily time frame indicating bullish trends.
We have also detected the formation of a bullish harami pattern in the 4-hour time frame.
ETHUSD touched an intraday low of 1633 and an intradayhHigh of 1694 in the Asian trading session today.
The STOCHRSI is indicating an oversold level, which indicates that the prices will continue to rise in the medium-term range.
The key support levels to watch are $1594 which is a 14-3 day raw stochastic at 50%, and $1637 at which the price crosses 9-day moving average stalls.
ETH has increased by 5.88% with a price change of 92.60$ in the past 24hrs and has a trading volume of 9.958 billion USD.
We can see an increase of 60.00% in the total trading volume in the last 24 hrs which is due to heavy buying seen at lower levels.
The Week Ahead
ETH has already made a failed attempt to cross the $1700 level by touching $1694 today. Now we are expecting a retest of the $1700 breach after which the next targets are located at $1800 and $1900 levels.
At present, the prices are moving in a consolidation channel above the $1650 level.
We can see the formation of a bullish ascending channel from $1535 towards the $1684 level.
The immediate short-term outlook for Ether has turned strongly bullish, the medium-term outlook has turned bullish, and the long-term outlook for Ether is neutral in present market conditions.
The resistance zone is located at $1701 which is the pivot point 2nd resistance level and at $1868 which is a 14-day RSI at 80%.
The weekly outlook is projected at $1800 with a consolidation zone of $1750.
Technical Indicators:
The relative strength index, RSI (14): is at 68.86 indicating a BUY
The moving average convergence divergence, MACD (12,26): is at 21.75 indicating a BUY
The average directional index: is at 23.83 indicating a BUY
The rate of price change: is at 22.11 indicating a BUY
Disclaimer: This Forecast represents FXOpen Companies opinion only, it should not be construed as an offer, invitation or recommendation in respect to FXOpen Companies products and services or as Financial Advice.
AUD/USD is correcting gains from the 0.7150 resistance zone. NZD/USD is also declining and reaching an important support at 0.6450.
Important Takeaways for AUD/USD and NZD/USD
The Aussie Dollar started a fresh decline from the 0.7150 resistance against the US Dollar.
There was a break below a key bullish trend line with support near 0.7080 on the hourly chart of AUD/USD.
NZD/USD also started a downside correction after it failed to clear 0.6540.
There is a connecting bullish trend line forming with support near 0.6440 on the hourly chart of NZD/USD.
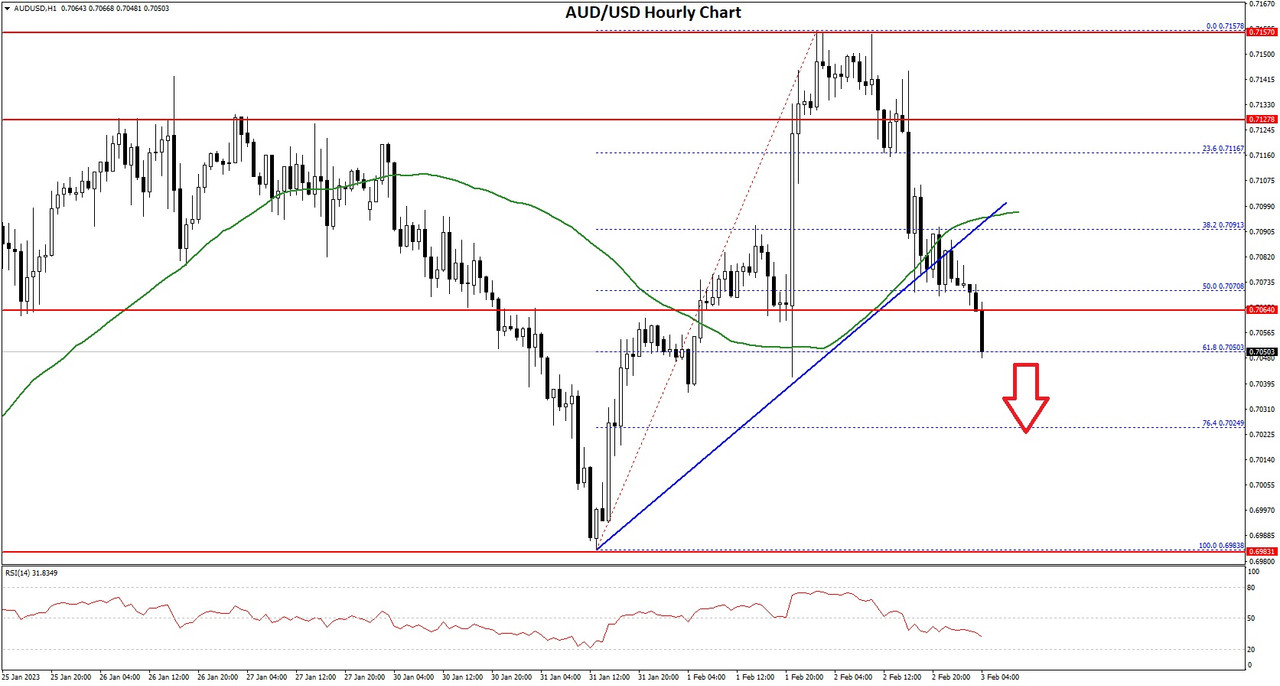
AUD/USD Technical Analysis
The Aussie Dollar gained pace above the 0.7100 resistance zone against the US Dollar. The AUD/USD pair even spiked above the 0.7150 level before the bears appeared.
The pair traded as high as 0.7157 on FXOpen and started a fresh downside correction. There was a clear move below the 0.7120 and 0.7100 support levels. The pair declined below the 50% Fib retracement level of the upward move from the 0.6983 swing low to 0.7157 high.
AUD/USD Hourly Chart
Besides, there was a break below a key bullish trend line with support near 0.7080 on the hourly chart of AUD/USD. The pair is now trading below 0.7080 and the 50 hourly simple moving average.
On the downside, an initial support is near the 0.7050 level. It is near the 61.8% Fib retracement level of the upward move from the 0.6983 swing low to 0.7157 high. The next support could be the 0.7000 level. If there is a downside break below the 0.7000 support, the pair could extend its decline towards the 0.6940 level.
On the upside, the AUD/USD pair is facing resistance near the 0.7080 level. The next major resistance is near the 0.7100 level.
A close above the 0.7100 level could start another steady increase in the near term. The next major resistance could be 0.7150.
Disclaimer: This Forecast represents FXOpen Companies opinion only, it should not be construed as an offer, invitation or recommendation in respect to FXOpen Companies products and services or as Financial Advice.
Disclaimer: This forecast represents FXOpen Companies opinion only, it should not be construed as an offer, invitation or recommendation in respect to FXOpen Companies products and services or as financial advice.
BTCUSD and XRPUSD Technical Analysis – 07th FEB 2023
BTCUSD – Bullish Harami Pattern Above $22658
Bitcoin continues its bullish momentum from last week and after touching a low of $22658 on 07th Feb, the prices started to correct upwards against the US Dollar and are now ranging above the $23000 handle in the European trading session today.
The price is back over the Pivot point in the daily timeframe indicating bullish trends.
We can clearly see a bullish Harami pattern above the $22658 handle which is a bullish reversal pattern because it signifies the end of a downtrend and a shift towards an uptrend.
Bitcoin touched an intraday low of 22658 in the Asian trading session and an intraday high of 23037 in the European trading session today.
The momentum indicator is back over zero in the 4-hourly timeframe indicating a bullish scenario.
The MACD indicator is giving a bullish divergence signal in the 1-hourly timeframe.
Both the STOCH and STOCHRSI are indicating overbought levels which means that in the immediate short-term a decline in the prices is expected.
The RSI indicator is back over 50 in both the 30-minutes and 1-hourly timeframe indicating bullish trends.
Relative strength index is at 58.15 indicating a strong demand for Bitcoin, and the continuation of the buying pressure in the markets.
Bitcoin is now moving below its 100 hourly Simple Moving average and below its 100 hourly Exponential Moving averages.
Most of the major technical indicators are giving a BUY signal, which means that in the immediate shor-term we are expecting targets of 23500 and 24500.
Average true range is indicating less market volatility with a mild bullish momentum.
Bitcoin bullish continuation seen above $22658.
The Williams percent range is indicating an overbought level.
The price is now trading just above its Pivot levels of $22887.
Short-term range is mild bullish.
Bitcoin Bullish Continuation Seen Above $22658
The prices of Bitcoin witnessed a downwards correction after crossing the $24000 levels. Now the markets are ranging into a consolidation channel above the $22500 handle.
After the consolidation phase is over, we are expecting upside moves in the range of $23500 to $24500 levels.
We can see the formation of a bullish price crossover pattern with the Adaptive Moving average AMA20 in both the 30-minutes and 1-hourly timeframes.
The immediate short-term outlook for Bitcoin is mild bullish, medium-term outlook has turned as bullish, and the long-term outlook remains neutral under present market conditions.
Bitcoin support zone is located at $22342 which is a 14-3 Day Raw Stochastic at 50% and at $22581 which is a 3-10 Day MACD Oscillator Stalls.
The price of BTCUSD is now facing its classic resistance levels of 23053 and Fibonacci resistance levels of 23352 after which the path towards 23500 will get cleared.
In the last 24hrs BTCUSD has increased by 0.84% by 190.97$ and has a 24hr trading volume of USD 24.800 Billion. We can see an increase of 13.07% in the trading volume as compared to yesterday, which appears to be normal.
The Week Ahead
Bitcoin has reached its highest levels this month at $24209 which was last seen on 20th Aug, 2022. We are now looking to cross the $25000 levels this month.
Daily RSI is printing at 62.55 which indicates a very strong demand for Bitcoin and the continuation of the bullish phase present in the markets in the short-term range.
We can see the formation of a bullish trendline from $22658 towards the $24118 levels.
The prices of BTCUSD are now facing its resistance zone located at $23406 which is a 14-Day RSI at 70% and at $23594 at which the price crosses 9-Day Moving Average Stalls.
Weekly outlook is projected at $25000 with a consolidation zone of $24000.
Technical Indicators:
Moving Averages Convergence Divergence (12,26): It is at 2.60 indicating a BUY.
Ultimate Oscillator: It is at 57.18 indicating a BUY.
Rate of Price Change: It is at 0.226 indicating a BUY.
Bull/Bear Power (13): It is at 175.73 indicating a BUY.
Disclaimer: This Forecast represents FXOpen Companies opinion only, it should not be construed as an offer, invitation or recommendation in respect to FXOpen Companies products and services or as Financial Advice.
Bitcoin values decline as major exchange halts Dollar transfers
The now rather infamous 'crypto winter' which referred to the latter part of 2022 had appeared to show some signs of subsiding recently.
After many months of relatively low and somewhat stagnant cryptocurrency values, some of the more popular digital currencies had begun to make a little bit of headway over the first few weeks of 2023.
By the end of January 2022, it looked as though the value of many of the most popular cryptocurrencies, especially Bitcoin and Ethereum, were emerging from the doldrums and beginning to make a resurgence in value, with Bitcoin hitting $23,783 on January 30.
Of course, this is a far cry from the $60,000 ballpark which Bitcoin reached in 2021, but considering the under-$20,000 range it has been languishing in for a few months, it is a considerable upturn in fortunes.
However, since yesterday, Bitcoin has been declining in value once again, going from $23,380 during the night (1.15am UK time) to $23,159 by 11.00am UK time today.
That is a 66 point decrease in value, 0.28% in percentage terms, which may not seem a large movement, but it does represent a downturn of considerable monetary value, putting an end to the climbing values.
It could be that accessibility may be a factor, as Binance, one of the world's largest cryptocurrency exchanges announced yesterday that will suspend U.S. dollar withdrawals and deposits for international customers beginning today, resulting in a significant capital outflow from Binance and Bitcoin withdrawal figures going up overall.
Binance stated that it remained 'net positive' after the withdrawal run took place, however such a rush to divest from an exchange in one go means that actual trading volume in Bitcoin would likely be affected, which may also be contributing to the lower values today.
Binance has stated that this suspension of US dollar transactions is temporary, but of course any action which causes a mass withdrawal of assets from a trading venue is always likely to affect overall trading volume.
So, whilst overall Bitcoin is being viewed through a bullish lens, largely because of the US Federal Reserve bank's latest less aggressive rate hike of just 25 basis points, which helped Bitcoin to maintain its rising trajectory and outperform as compared to other asset classes, any action affecting trading in which a mass withdrawal takes place is likely to have some effect.
It may be temporary, and if so, volatility is definitely on its way back to the crypto market.
Disclaimer: This Forecast represents FXOpen Companies opinion only, it should not be construed as an offer, invitation or recommendation in respect to FXOpen Companies products and services or as Financial Advice.
Disclaimer: This forecast represents FXOpen Companies opinion only, it should not be construed as an offer, invitation or recommendation in respect to FXOpen Companies products and services or as financial advice.
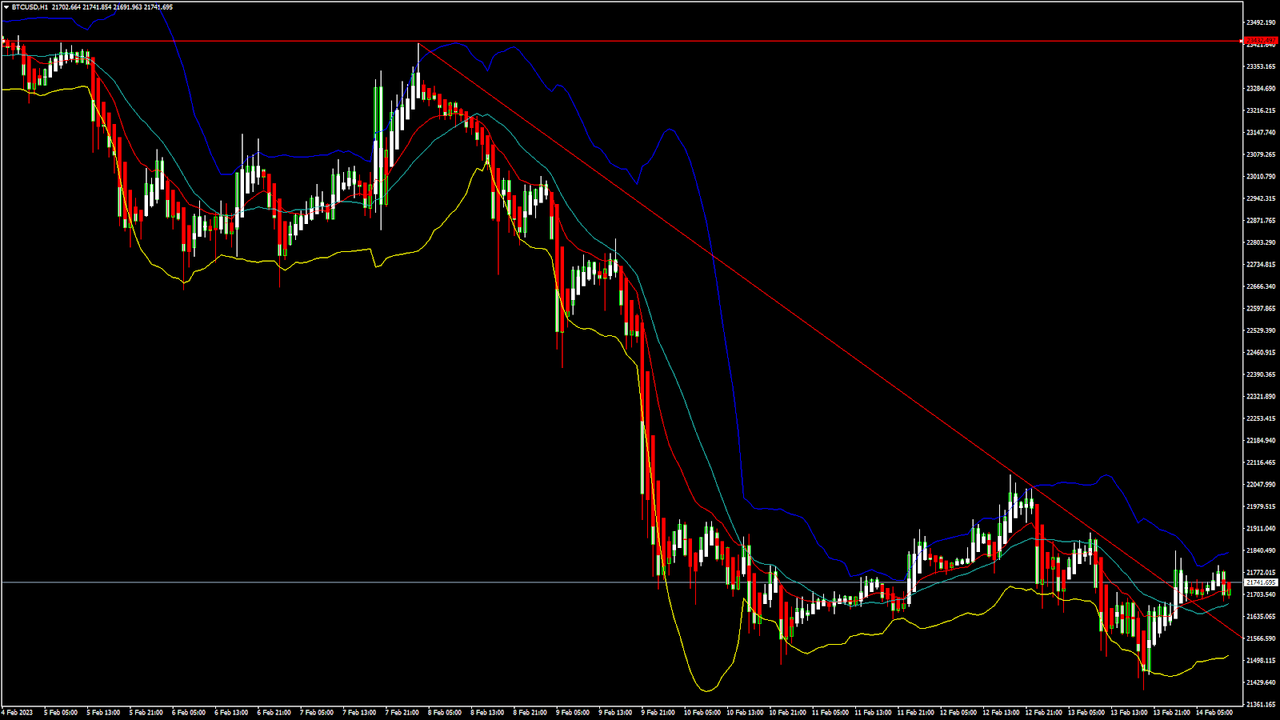
BTCUSD and XRPUSD Technical Analysis – 14th FEB 2023
BTCUSD: The Evening Star Pattern Below $23432
Bitcoin was unable to sustain its bullish momentum last week and after touching a high of $22432 started to decline against the US dollar, touching a low of $21450 on 13th Feb.
We have seen a bearish opening of the markets this week.
We can clearly see the evening star pattern below the $23432 handle which is a bearish reversal pattern because it signifies the end of an uptrend and a shift towards a downtrend.
Bitcoin touched an intraday high of 21839 in the Asian trading session and an intraday low of 21683 in the European trading session today.
We can see the formation of a three black crows pattern in the weekly time frame indicating bearish trends.
The Ichimoku price is under the cloud in the 2-hour time frame indicating bearish trends.
Both the STOCH and Williams percent range are indicating overbought levels which means that in the immediate short term a decline in the prices is expected.
The RSI indicator is back under 50 in the 2-hour time frame indicating the bearish nature of the markets.
The relative strength index is at 48.77 indicating a NEUTRAL demand for bitcoin, and the shift towards the consolidation phase in the markets.
Bitcoin is now moving below its 100 hourly simple moving average and below its 100 hourly exponential moving averages.
Some of the major technical indicators are giving a SELL signal, which means that in the immediate short term, we are expecting targets of 21000 and 20500.
The average true range is indicating LESS market volatility with a mildly bearish momentum.
Bitcoin: bearish reversal seen below $23432.
The commodity channel index is indicating a NEUTRAL level.
The price is now trading just below its pivot levels of $21764.
The short-term range is mildly bearish.
Bitcoin: Bearish Reversal Seen Below $23432
The price of Bitcoin was unable to cross the $24K mark last week, and we can see a continuous fall in the levels now trading below the $22K handle.
As some of the technical indicators are also giving a neutral stance of the markets, we are expecting that a bullish reversal is possible after touching the $20500 level.
We have also detected the formation of bearish engulfing lines in the 30-minute time frame.
The MACD crosses down its moving average in the 15-minute time frame indicating the bearish nature of the markets.
We can see the formation of a bearish price crossover pattern with the adaptive moving average AMA20 in both the 30-minute and 2-hour time frames.
The immediate short-term outlook for bitcoin is mildly bearish, the medium-term outlook has turned bearish, and the long-term outlook remains neutral under present market conditions.
Bitcoin’s support zone is located at $20027 at which the price crosses the 40-day moving average, and at $20937 at which the price crosses the 18-day moving average stalls.
The price of BTCUSD is now facing its classic support level of 21703 and Fibonacci support level of 21502 after which the path towards 21000 will get cleared.
In the last 24hrs BTCUSD has increased by 0.57% by 122.76$ and has a 24hr trading volume of USD 21.364 billion. We can see an increase of 0.42% in the trading volume compared to yesterday, which appears to be normal.
The Week Ahead
Bitcoin is now facing the extended crypto winter due to which the prices are unable to rise above the $25000 level.
We are now heading towards the $21500 level this week.
The daily RSI is printing at 47.08 which indicates a NEUTRAL demand for bitcoin and the continuation of the bearish phase present in the markets in the short-term range.
We can see the formation of a bearish trend line from $23432 towards the $21576 level.
The price of BTCUSD is now facing its support zone located at $20884 which is a 38.2% retracement from a 13-week high.
The weekly outlook is projected at $21000 with a consolidation zone of $20500.
Technical Indicators:
The average directional index (14): It is at 28.57 indicating a SELL.
The ultimate oscillator: It is at 39.72 indicating a SELL.
The rate of price change: It is at -5.67 indicating a SELL.
Bull/bear power (13): It is at -1085.58 indicating a SELL.
Disclaimer: This Forecast represents FXOpen Companies opinion only, it should not be construed as an offer, invitation or recommendation in respect to FXOpen Companies products and services or as Financial Advice.
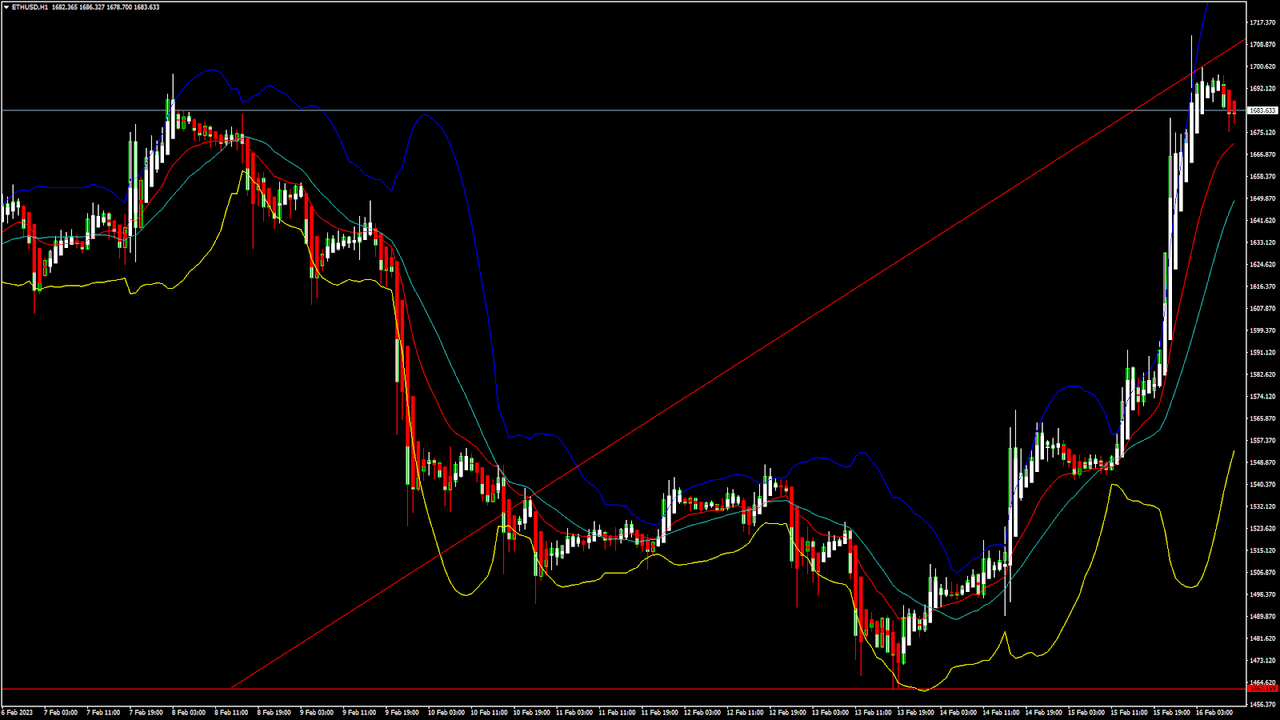
ETHUSD and LTCUSD Technical Analysis – 16th FEB, 2023
ETHUSD: Double Bottom Pattern Above $1462
Ethereum was unable to sustain its bearish momentum and after touching a low of $1462 on 13th Feb, the price started to correct upwards against the US dollar now ranging above the $1650 handle today in the Asian trading session.
We can see a continuous escalation in the price of Ethereum which is expected to push up its price above the $1700 handle.
The price of ETH has touched a new record high of 5 months.
We can clearly see a double bottom pattern above the $1462 handle which is a bullish pattern and signifies the end of a bearish phase and the start of a bullish phase in the markets.
ETH is now trading just above its pivot level of 1681 and moving into a strongly bullish channel. The price of ETHUSD is now testing its classic resistance level of 1687 and Fibonacci resistance level of 1693 after which the path towards 1800 will get cleared.
We can see the formation of bullish engulfing lines in the weekly time frame.
The relative strength index is at 75.92 indicating a very strong demand for Ether and the continuation of the buying pressure in the markets.
The RSI is giving an overbought signal, which means that the price is expected to decline in the short-term range.
Most of the technical indicators are giving a STRONG BUY market signal.
Most of the moving averages are giving a STRONG BUY signal at the current market level of $1683.
ETH is now trading above both the 100 hourly simple and 100 hourly exponential moving averages.
Ether: bullish reversal seen above the $1462 mark.
The short-term range appears to be strongly bullish.
ETH continues to remain above the $1650 level.
The average true range is indicating LESS market volatility.
Ether: Bullish Reversal Seen Above $1462
ETHUSD has now resumed its bullish trend and we are now expecting a retest of the $1800 level soon after which the next visible targets are located at $1800 and $2000 levels.
We can see the formation of a bullish price crossover pattern with the adaptive moving average AMA20 in the weekly time frame.
We have also detected the formation of a white gravestone/inverted hammer pattern in the daily time frame conforming to the bullish reversal.
ETHUSD touched an intraday high of 1707 and an intraday low of 1664 in the Asian trading session today.
The Aroon indicator is giving a bullish trend in the daily time frame.
The key support levels to watch are $1657 at which the price crosses 9-day moving average stalls, and $1679 which is a 3-10 day MACD oscillator stalls.
ETH has increased by 8.76% with a price change of 135.58$ in the past 24hrs and has a trading volume of 12.329 billion USD.
We can see an increase of 34.47% in the total trading volume in the last 24 hrs which is due to the heavy buying seen at lower levels.
The Week Ahead
ETH has now moved into a breakout zone which is expected to continue this week and now we are heading towards the $1800 level.
At present the prices are moving in a super bullish zone above the $1650 levels.
We can see the formation of a bullish ascending channel from $1462 towards the $1713 level.
The immediate short-term outlook for Ether has turned strongly bullish, the medium-term outlook has turned bullish, and the long-term outlook for Ether is neutral under present market conditions.
The resistance zone is located at $1809 which is a 14-Day RSI at 70%, and at $1842 which is a pivot point 3rd level resistance.
Weekly outlook is projected at $1900 with a consolidation zone of $1850.
Technical Indicators:
The STOCH (9,6): is at 58.99 indicating a BUY.
The moving average convergence divergence (12,26): is at 32.22 indicating a BUY.
The Williams percent range: is at -20.25 indicating a BUY.
The rate of price change: is at 5.77 indicating a BUY.
Disclaimer: This Forecast represents FXOpen Companies opinion only, it should not be construed as an offer, invitation or recommendation in respect to FXOpen Companies products and services or as Financial Advice.
Disclaimer: This forecast represents FXOpen Companies opinion only, it should not be construed as an offer, invitation or recommendation in respect to FXOpen Companies products and services or as financial advice.
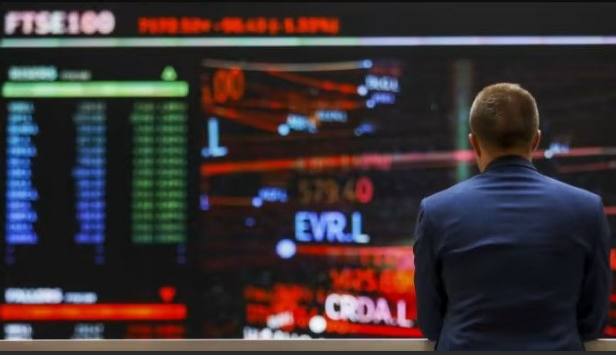
8,000 was a pipe dream for the FTSE 100... for now!
It has been clear for almost two years that the FTSE 100 index, which consists of the 100 most prestigious and well capitalized blue-chip companies listed on the London Stock Exchange, has been the exception to the overall direction of most other assets in the United Kingdom.
Whilst the Pound, along with many other business sectors, floundered, and a cost of living crisis engulfed the nation whilst energy prices and the cost of everyday consumables and necessities rocketed due to 50-year highs in inflation, the FTSE 100 remained not only very buoyant but reached unprecedented highs.
Back in mid-2021, euphoric analysts were waxing lyrical on financial news channels in mainstream media about how the FTSE 100 index had broken the 7,000 point barrier. That was during a time at which the British government was lining up its ministers on an almost daily basis to tell the public how intent on locking down the country's businesses and public on a repeated basis, disabling businesses and impoverishing the general public.
Now, here we are a year and a half later, and whilst the lockdowns have stopped, they have been replaced by geopolitical uncertainty and an intent involvement by the British government in sanctions against one of the world's largest oil and gas producing country as well as massive public spending during a time of recession in which millions of people are having to tighten their belts and interest rates are four times higher than they were two years ago with inflation still in double digits.
Despite this perhaps alarming backdrop, the FTSE 100 is not only hovering above the 7,000 points mark that it was during the equally surprising trends demonstrated in 2021, but it has been almost reaching 8,000 points!
Just last week, many seasoned analysts in financial institutions had looked toward the 8,000 point mark being reached.
This looked very likely last week, as the value of the FTSE 100 index continued to rise rapidly, but today things have taken a turn.
The FTSE 100 index dropped by 0.68% during the early hours of the London trading session and by 9.00am UK time, it was trading at 7,954 points.
That is still very high and is still at its highest point in over a year apart from last Thursday when it briefly broke through the 8,000 points mark and reached 8012 points which is an all time high.
Whilst it is still very interesting and quite fascinating that these high levels are being reached by the performance of long-established traditional companies that make up the FTSE 100 index in such bleak economic times, the seemingly endless upward surge has stopped and momentum has tailed off.
That it is still high is of course remarkable, but the real news here is that the one economic measure that has been bucking the trend for a long time has begun to stop increasing in value at such a rapid rate.
What is perhaps odd here is that FTSE 100 opened lower this morning even though there has been better than expected news on public sector debt in the United Kingdom - something many people are very worried about - and ahead of a raft of PMI announcements.
It is highly likely that some macro data has affected the values, and the only negative information that has come to light is that medical firm Smith & Nephew announced a drop in annual operating profits as margins dipped.
The global medical technology company said operating profit margins slipped to 8.6% from 11.4% reflecting higher inflation in freight and logistics, the impact of China VBP, as well as sales and marketing expenditure levels returning to more normal levels. However despite this, its stock rose in value by over 6%!
InterContinental Hotels PLC experienced a drop in share value of 2.1%, following its announcement of a forthcoming $750 million share buyback. That is still not much to rock the entire index however.
Perhaps this is just a small blip, but it is definitely one of interest.
Disclaimer: This Forecast represents FXOpen Companies opinion only, it should not be construed as an offer, invitation or recommendation in respect to FXOpen Companies products and services or as Financial Advice.
Post automatically merged:
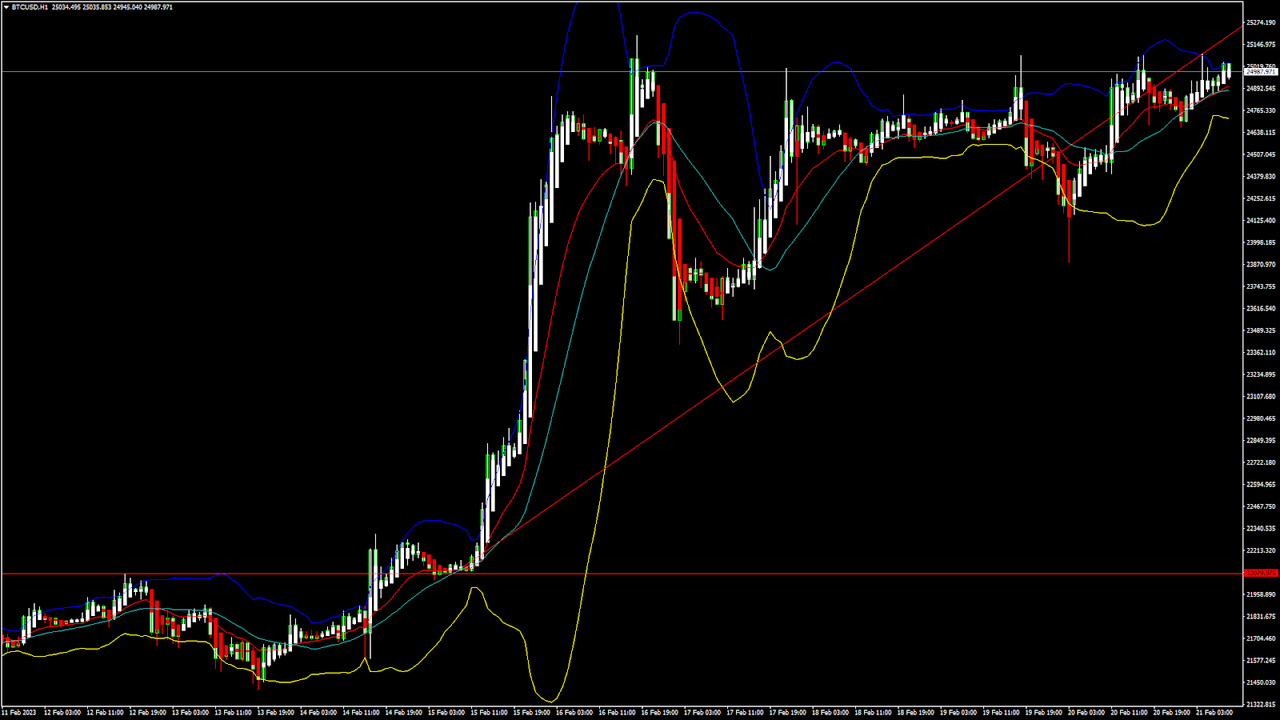
BTCUSD and XRPUSD Technical Analysis – 21st FEB 2023
BTCUSD: Three WHITE Soldiers Pattern Above $22079
Bitcoin was unable to sustain its bearish momentum last week and after touching a low of $22079 the price started to correct upwards against the US dollar, touching a high of $25093 today in the Asian trading session.
We have seen a bullish opening of the markets this week.
We can clearly see the three white soldiers pattern above the $22079 handle which is a bullish reversal pattern because it signifies the end of a downtrend and a shift towards an uptrend.
Bitcoin touched an intraday low of 24681 and an intraday high of 25093 in the Asian trading session today.
We can see that the MACD indicator is back over zero in the weekly time frame indicating bullish trends.
We can see a bullish price crossover with moving average MA50 in the weekly time frame indicating bullish trends.
Both the STOCH and STOCHRSI are indicating overbought levels which means that in the immediate short term, a decline in the prices is expected.
The resistance of the channel is broken in the daily time frame indicating a bullish scenario.
The relative strength index is at 62.08 indicating a STRONG demand for bitcoin, and the continuation of the buying pressure in the markets.
Bitcoin is now moving above its 100 hourly simple moving average and above its 100 hourly exponential moving averages.
Most of the major technical indicators are giving a buy signal, which means that in the immediate short term, we are expecting targets of 25000 and 27500.
The average true range is indicating less market volatility with a strong bullish momentum.
Bitcoin: Bullish reversal seen above $22079.
The Williams percent range is giving an overbought signal.
The price is now trading just below its pivot level of $25005.
The short-term range is strongly BULLISH.
Bitcoin: Bullish Reversal Seen Above $22079
The price of bitcoin is marching ahead of the $25000 levels amid improving consumer sentiments and a shift towards a high demand market.
The momentum indicator is back over zero in the 15-minute time frame indicating a bullish outlook.
The MACD crosses up its moving average in the 15-minute time frame.
We can see that the prices have entered into a supper bullish zone and now we are heading towards the $26000 and $27500 levels.
The immediate short-term outlook for bitcoin is strongly bullish, the medium-term outlook has turned bullish, and the long-term outlook remains neutral under present market conditions.
Bitcoin’s support zone is located at $23074 at which the price crosses 18-day moving average stalls, and $23315 which is a pivot point 2nd support point.
The price of BTCUSD is now facing its classic resistance level of 25077 and Fibonacci resistance level of 25120 after which the path towards 26000 will get cleared.
In the last 24hrs, BTCUSD has increased by 2.14% by 524.45$ and has a 24hr trading volume of USD 27.875 billion. We can see a decrease of 2.34% in the trading volume compared to yesterday, which appears to be normal.
The Week Ahead
Bitcoin needs to continue its bullish moves this week, which will further validate the end of the crypto winter and the start of a bullish run for Bitcoin which was long overdue.
There is an ascending channel forming with the current support at $23165 at which the price crosses the 18-day moving average.
The daily RSI is printing at 66.97 which indicates a VERY STRONG demand for bitcoin and the continuation of the bullish phase present in the markets in the short-term range.
We can see the formation of a bullish trend line from $22079 towards the $25265 level.
The price of BTCUSD is now facing its resistance zone located at $25890 which is a pivot point 2nd resistance level and $26017 which is a 3-10 day MACD oscillator stalls.
The weekly outlook is projected at $27000 with a consolidation zone of $26000.
Technical Indicators:
The average directional index (14): is at 32.84 indicating a BUY.
The ultimate oscillator: is at 53.92 indicating a BUY.
The rate of price change: is at 0.979 indicating a BUY.
Bull/bear power (13): is at 204.85 indicating a BUY.
Disclaimer: This Forecast represents FXOpen Companies opinion only, it should not be construed as an offer, invitation or recommendation in respect to FXOpen Companies products and services or as Financial Advice.
This site uses cookies to help personalize content, tailor your experience, and keep you logged in if you register.
By continuing to use this site, you are consenting to our use of cookies.