- Jul 2, 2022
- 385
- 4
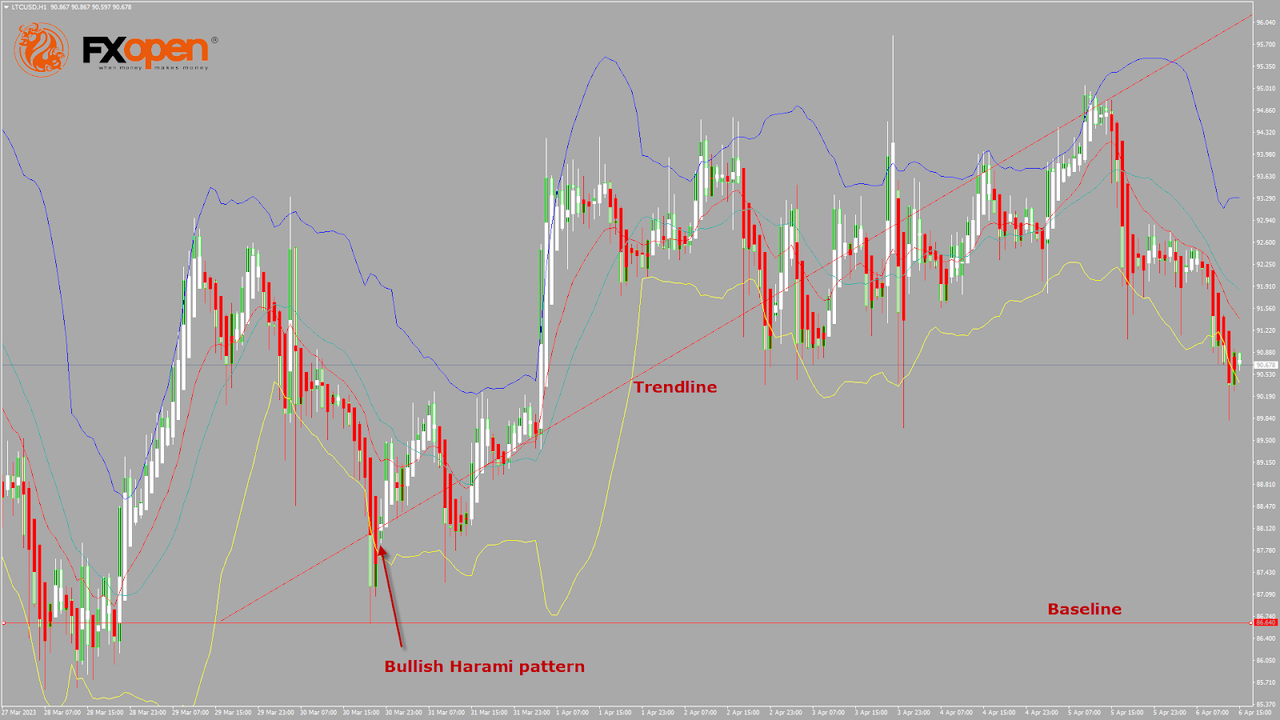
ETHUSD and LTCUSD Technical Analysis – 23rd FEB, 2023

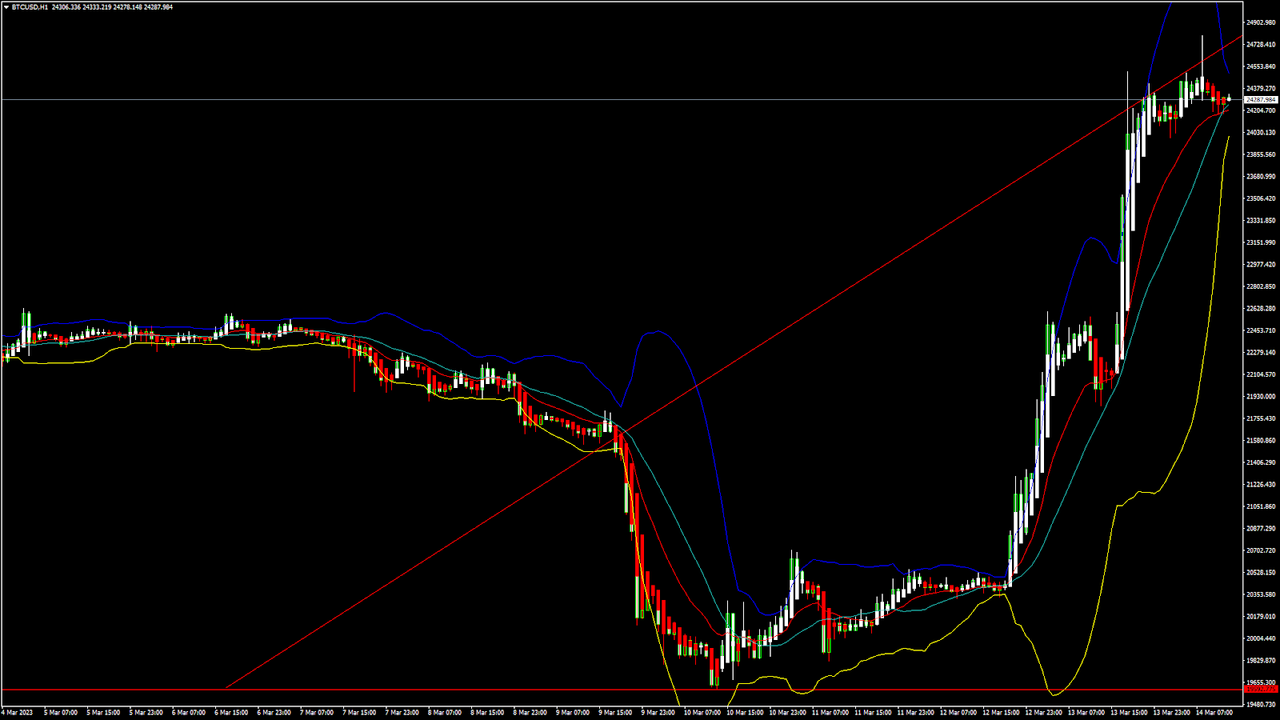
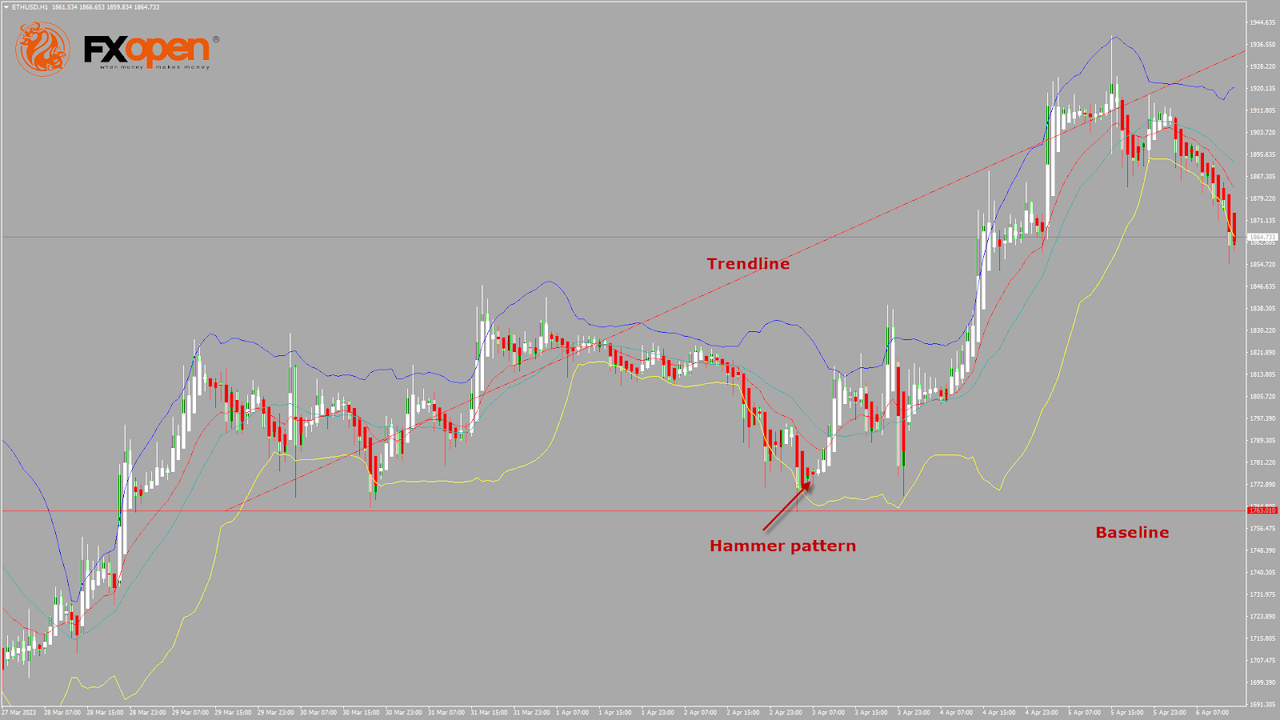
ETHUSD: Hammer Pattern Above $1596
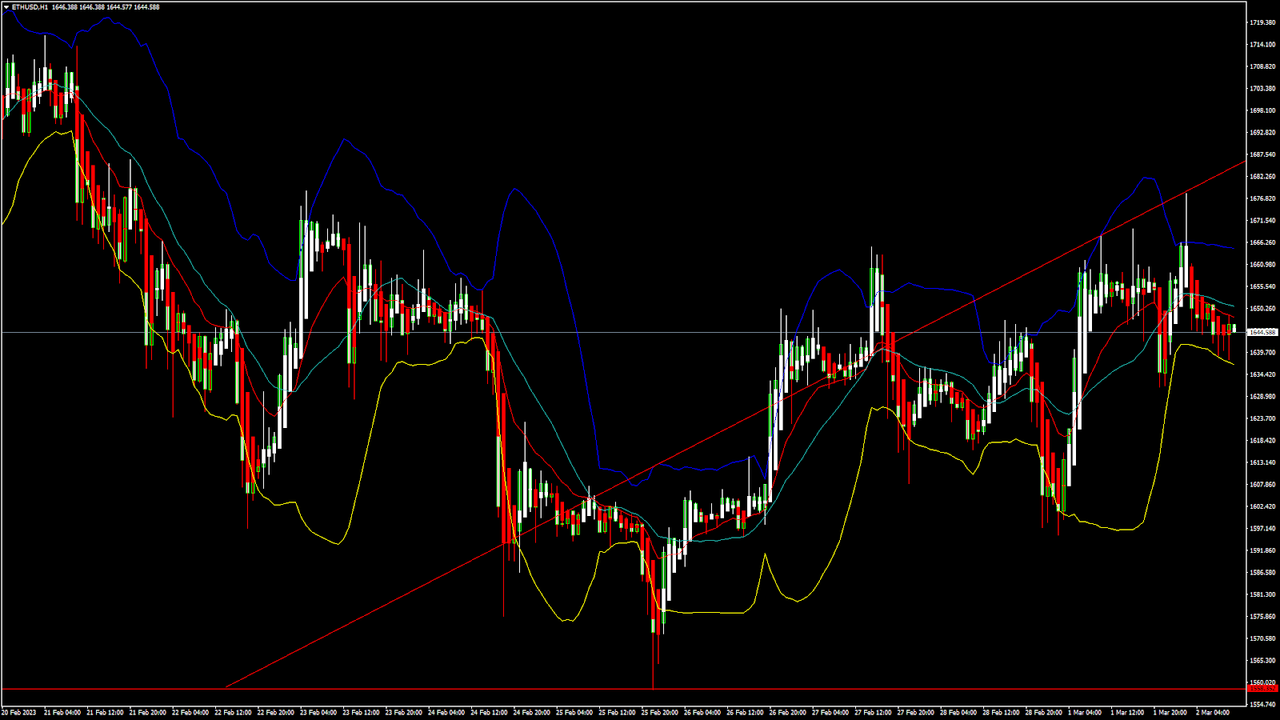
Ethereum was unable to sustain its bearish momentum and after touching a low of 1596 on 22nd Feb, the price started to correct upwards against the US dollar crossing the $1650 handle today in the European trading session.
We have seen a bullish opening of the markets this week.
We can clearly see a hammer pattern above the $1596 handle which is a bullish pattern and signifies the end of a bearish phase and the start of a bullish phase in the markets.
ETH is now trading just below its pivot level of 1666 and moving into a mildly bullish channel. The price of ETHUSD is now testing its classic resistance level of 1669 and Fibonacci resistance level of 1671 after which the path towards 1700 will get cleared.
The relative strength index is at 61.93 indicating a strong demand for Ether and the continuation of the bullish phase in the markets.
We can see the formation of bullish engulfing lines in the daily time frame.
Both the STOCH and STOCHRSI are indicating an overbought market, which means that the prices are expected to decline in the short-term range.
Most of the technical indicators are giving a strong buy market signal.
Most of the moving averages are giving a strong buy signal, and we are now looking at the levels of $1700 to $1750 in the short-term range.
ETH is now trading above its 100 & 200 hourly simple and exponential moving averages.
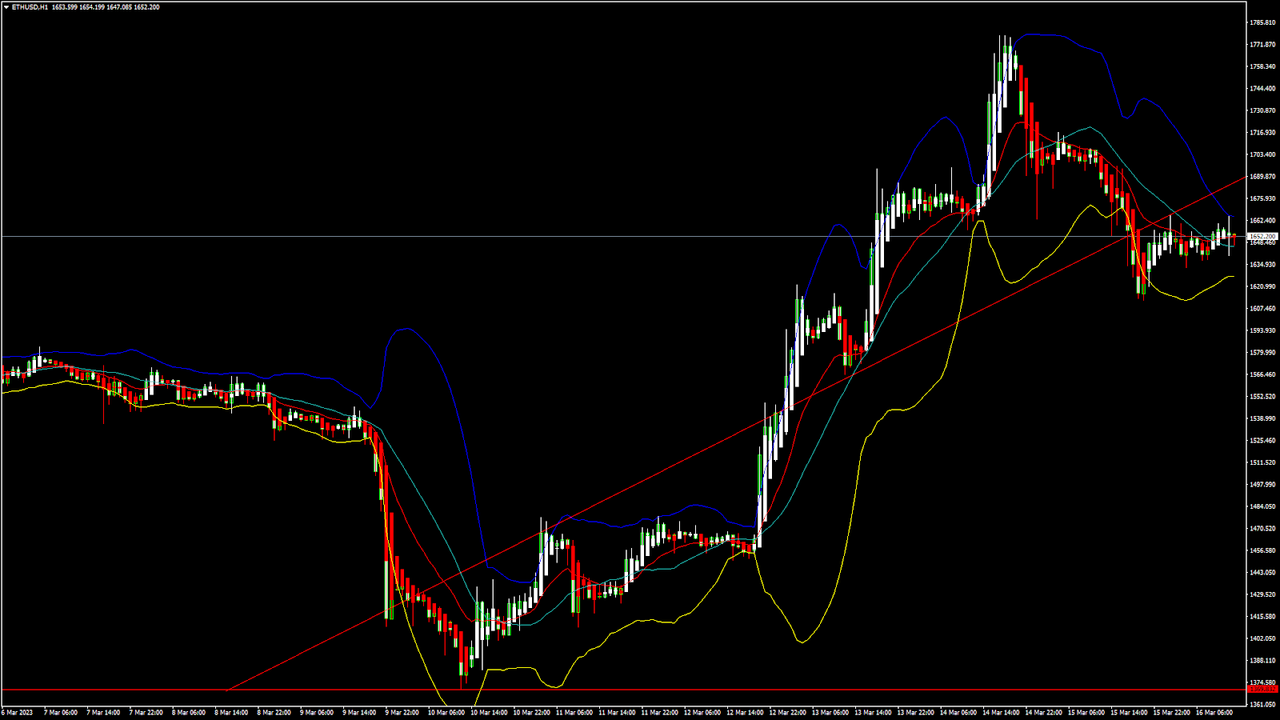
Ether: Bullish Reversal Seen Above $1596
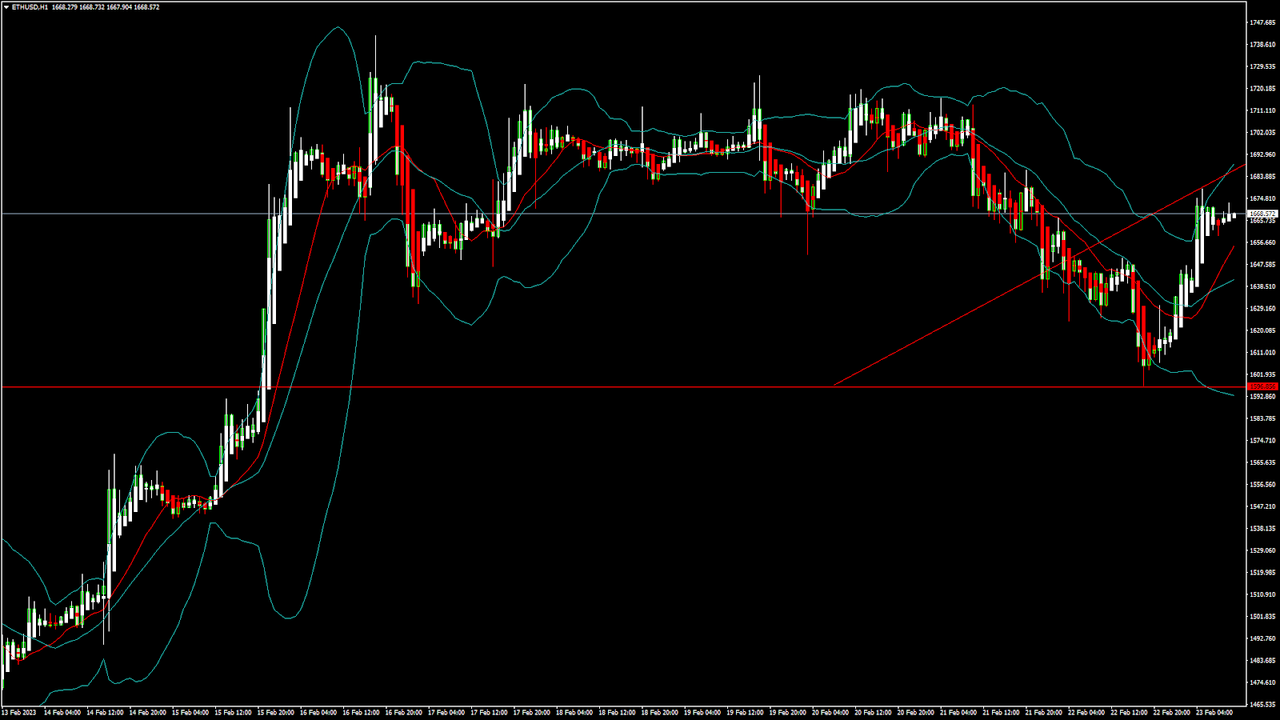
ETHUSD is now moving in a strongly bullish channel with the prices trading above the $1650 handle in the European trading session today.
ETH touched an intraday low of 1637 and an intraday high of 1678 in the Asian trading session today.
The horizontal resistance is broken in the daily time frame, indicating bullish trends.
The MACD crosses up its moving average in the 4-hour time frame indicating bullish nature of the markets.
The Ichimoku – bullish crossover: Tenkan and Kjiun patterns are visible which is a bulish indication of the markets.
The Ichimoku price is over the cloud in the 1-hour time frame indicating a bullish scenario.
The Aroon indicator is giving a bullish trend in the 15-minute time frame.
The key support levels to watch are $1603 which is a 50% retracement from a 4-week high/low, and $1631 at which the price crosses the 9-day moving average.
ETH has increased by 1.84% with a price change of 30.19$ in the past 24hrs and has a trading volume of 8.818 billion USD.
We can see an increase of 1.15% in the total trading volume in the last 24 hrs which appears to be normal.
The Week Ahead
ETH’s price continues to remain in a bullish zone against the US dollar and bitcoin. ETHUSD is expected to move higher towards the $1700 and $1800 levels this week.
On the upside we are now looking at the immediate targets of 1724 which is a pivot point 3rd level resistance, and 1741 which is a 13-week high.
The immediate short-term outlook for Ether has turned strongly bullish, the medium-term outlook has turned bullish, and the long-term outlook for Ether is neutral in present market conditions.
The price of ETHUSD will need to remain above the important support level of $1628 which is a pivot point.
The weekly outlook is projected at $1800 with a consolidation zone of $1750.
VIEW FULL ANALYSIS VISIT - FXOpen Blog...
Disclaimer: This Forecast represents FXOpen Companies opinion only, it should not be construed as an offer, invitation or recommendation in respect to FXOpen Companies products and services or as Financial Advice.
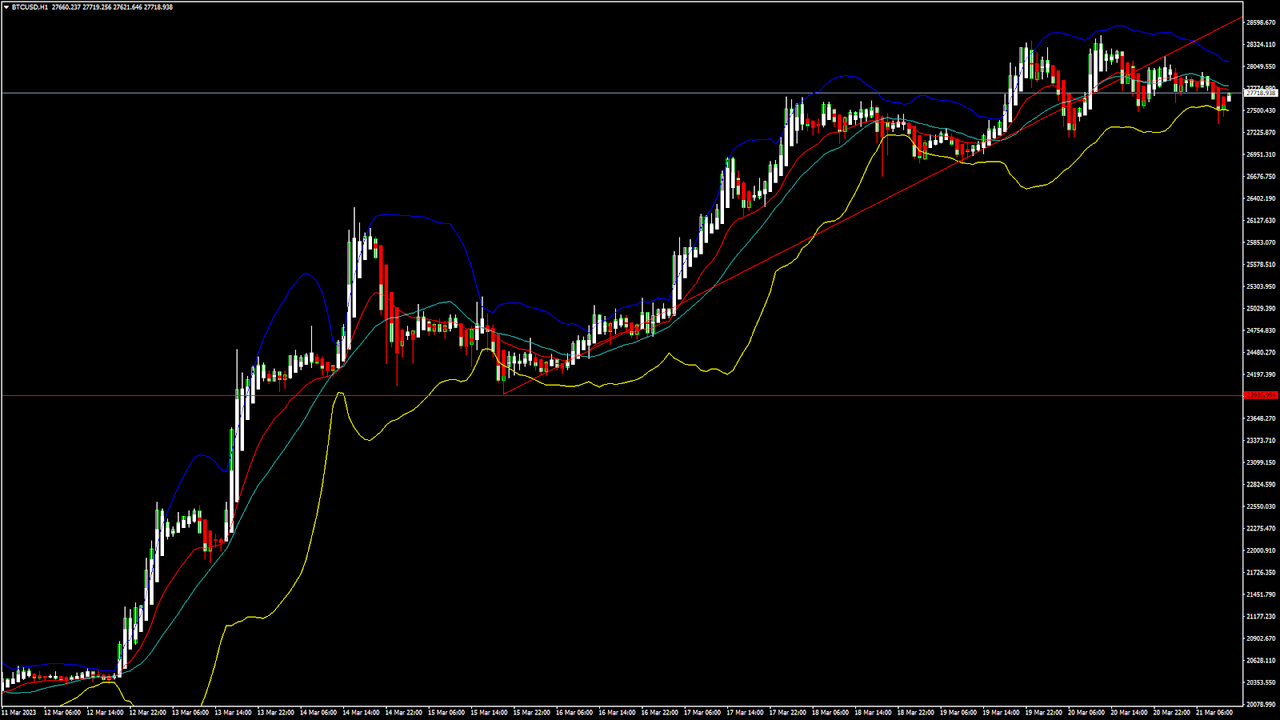
ETHUSD: Hammer Pattern Above $1596
Ethereum was unable to sustain its bearish momentum and after touching a low of 1596 on 22nd Feb, the price started to correct upwards against the US dollar crossing the $1650 handle today in the European trading session.
We have seen a bullish opening of the markets this week.
We can clearly see a hammer pattern above the $1596 handle which is a bullish pattern and signifies the end of a bearish phase and the start of a bullish phase in the markets.
ETH is now trading just below its pivot level of 1666 and moving into a mildly bullish channel. The price of ETHUSD is now testing its classic resistance level of 1669 and Fibonacci resistance level of 1671 after which the path towards 1700 will get cleared.
The relative strength index is at 61.93 indicating a strong demand for Ether and the continuation of the bullish phase in the markets.
We can see the formation of bullish engulfing lines in the daily time frame.
Both the STOCH and STOCHRSI are indicating an overbought market, which means that the prices are expected to decline in the short-term range.
Most of the technical indicators are giving a strong buy market signal.
Most of the moving averages are giving a strong buy signal, and we are now looking at the levels of $1700 to $1750 in the short-term range.
ETH is now trading above its 100 & 200 hourly simple and exponential moving averages.
- Ether: bullish reversal seen above the $1596 mark.
- The short-term range appears to be strongly bullish.
- ETH continues to remain above the $1650 levels.
- The average true range is indicating less market volatility.
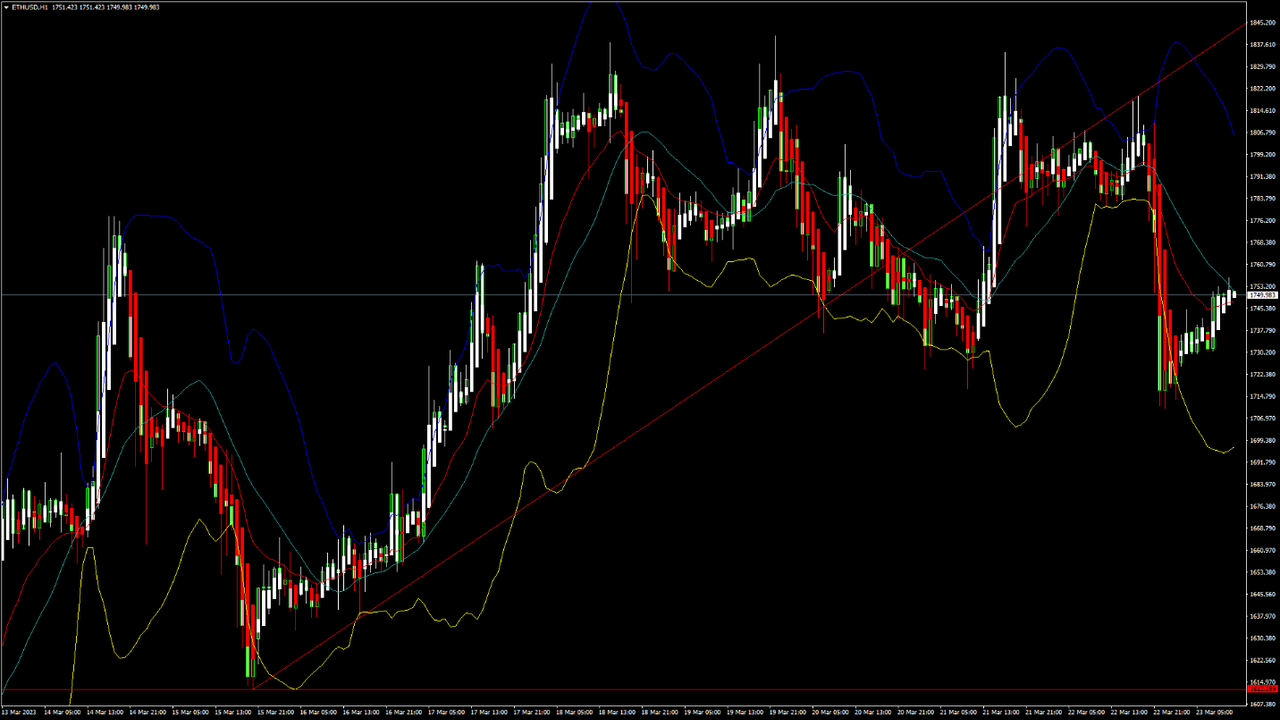
Ether: Bullish Reversal Seen Above $1596
ETHUSD is now moving in a strongly bullish channel with the prices trading above the $1650 handle in the European trading session today.
ETH touched an intraday low of 1637 and an intraday high of 1678 in the Asian trading session today.
The horizontal resistance is broken in the daily time frame, indicating bullish trends.
The MACD crosses up its moving average in the 4-hour time frame indicating bullish nature of the markets.
The Ichimoku – bullish crossover: Tenkan and Kjiun patterns are visible which is a bulish indication of the markets.
The Ichimoku price is over the cloud in the 1-hour time frame indicating a bullish scenario.
The Aroon indicator is giving a bullish trend in the 15-minute time frame.
The key support levels to watch are $1603 which is a 50% retracement from a 4-week high/low, and $1631 at which the price crosses the 9-day moving average.
ETH has increased by 1.84% with a price change of 30.19$ in the past 24hrs and has a trading volume of 8.818 billion USD.
We can see an increase of 1.15% in the total trading volume in the last 24 hrs which appears to be normal.
The Week Ahead
ETH’s price continues to remain in a bullish zone against the US dollar and bitcoin. ETHUSD is expected to move higher towards the $1700 and $1800 levels this week.
On the upside we are now looking at the immediate targets of 1724 which is a pivot point 3rd level resistance, and 1741 which is a 13-week high.
The immediate short-term outlook for Ether has turned strongly bullish, the medium-term outlook has turned bullish, and the long-term outlook for Ether is neutral in present market conditions.
The price of ETHUSD will need to remain above the important support level of $1628 which is a pivot point.
The weekly outlook is projected at $1800 with a consolidation zone of $1750.
VIEW FULL ANALYSIS VISIT - FXOpen Blog...
Disclaimer: This Forecast represents FXOpen Companies opinion only, it should not be construed as an offer, invitation or recommendation in respect to FXOpen Companies products and services or as Financial Advice.