Daily Market Analysis By FXOpen

FXOpen Trader

Active Member
Jul 2, 2022
385
4
ETHUSD Technical Analysis – 08th SEP, 2022


ETHUSD: Hammer Pattern Above $1490

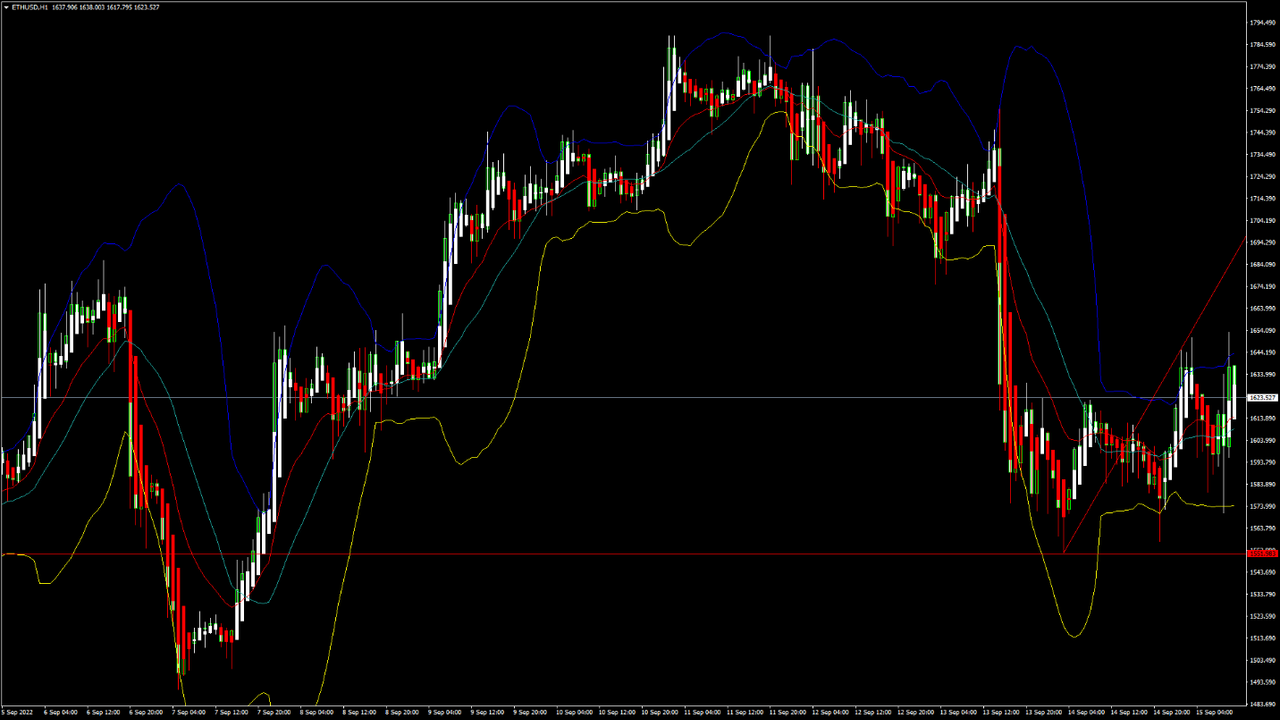
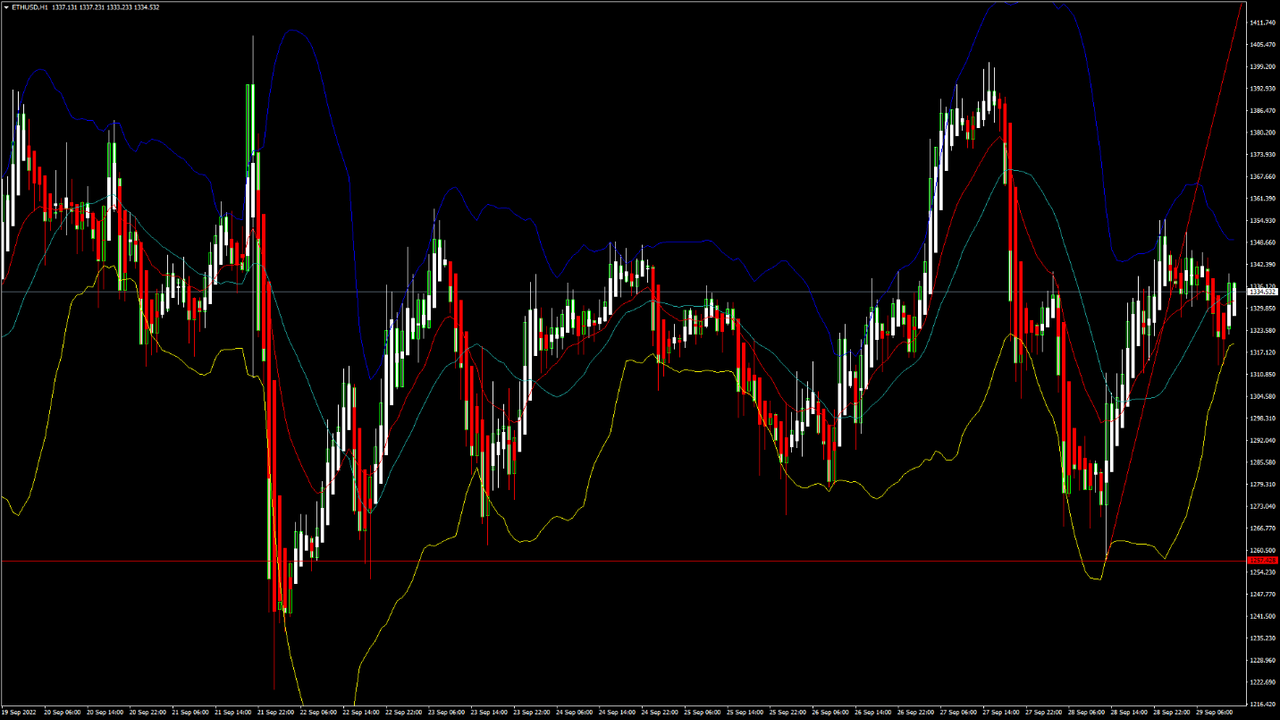
Ethereum was unable to sustain its bearish momentum and after touching a low of 1492 on 07th Sep started to correct upwards against the US dollar, crossing the $1600 handle in the European trading session today.

We can see a continued buying pressure since yesterday and the formation of a bullish trendline from $1490 towards $1685 level.

We can clearly see a hammer pattern above the $1490 handle which is a bullish pattern and signifies the end of a bearish phase and the start of a bullish phase in the markets.

ETH is now trading just above its pivot level of 1613 and moving into a strong bullish channel. The price of ETHUSD is now testing its classic resistance level of 1630 and Fibonacci resistance level of 1647 after which the path towards 1700 will get cleared.

The relative strength index is at 58 indicating a STRONGER demand for Ether and the continuation of the uptrend in the markets.

We can see the aroon indicator giving a bullish trend in the weekly time frame.

We have also detected a moving average crossover pattern between the MA50 & MA100 in the 30-minute time frame.

The STOCHRSI is indicating an OVERSOLD market, which means that the prices are expected to correct upwards in the short-term range.

Most of the technical indicators are giving a STRONG BUY market signal.

Most of the moving averages are giving a BUY signal and we are now looking at the levels of $1700 to $1800 in the short-term range.

ETH is now trading Above both the 100 & 200 hourly simple and exponential moving averages.

  • Ether: bullish reversal seen above the $1490 mark
  • The short-term range appears to be strongly BULLISH
  • ETH continues to remain above the $1600 levels
  • The average true range is indicating LESS market volatility

Ether: Bullish Reversal Seen Above $1490


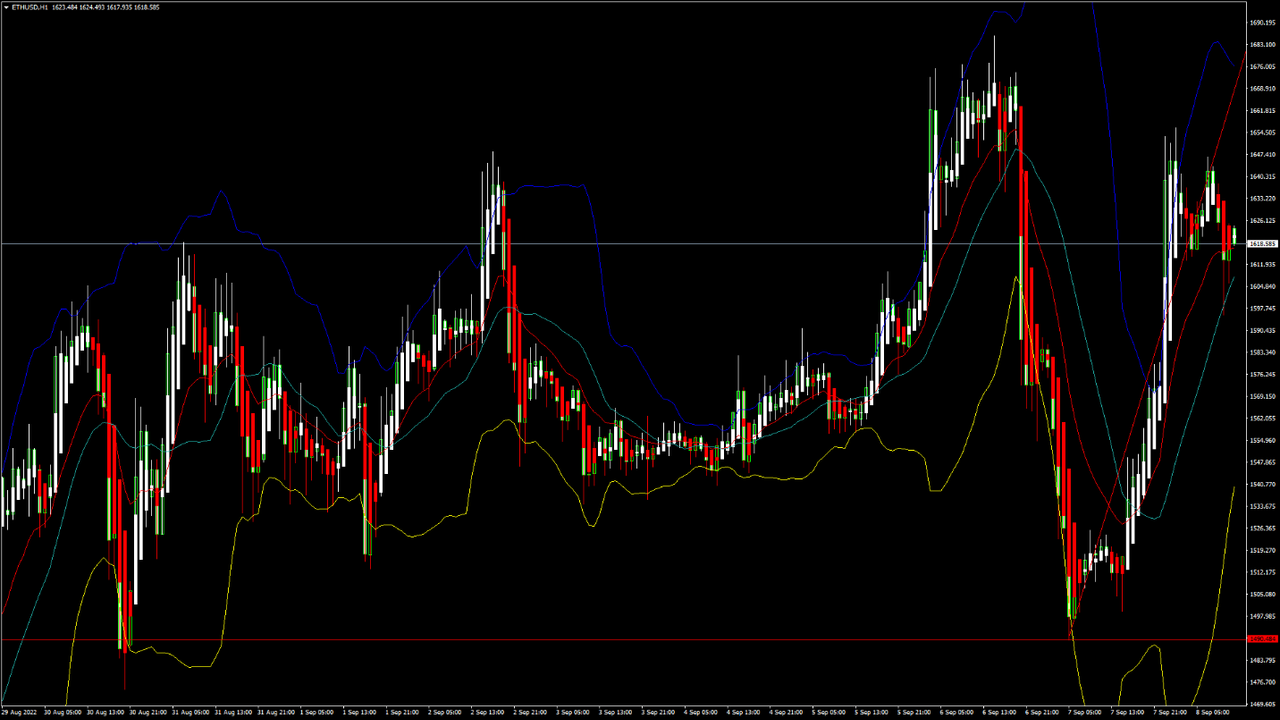
ETHUSD is moving into a strong bullish channel with the prices trading above the $1600 handle in the European trading session today.

ETH touched an intraday high of 1656 in the Asian trading session and an intraday low of 1597 in the European trading session today.

A three white soldiers pattern is visible in the 30-minutes time frame indicating the underlying bullish nature of the markets.

We can see the formation of a bullish harami cross pattern in the 15-minute time frame which indicates that now we are heading towards the $1800 mark.

The daily RSI is printing at 50 indicating a neutral demand in the long-term range.

Ethereum continues to move into a rising trend channel which is expected to continue in the short-term range.

The key support levels to watch are $1515 and $1581, and the prices of ETHUSD need to remain above these levels for the continuation of the bullish reversal in the markets.

ETH has increased by 6.68% with a price change of 101$ in the past 24hrs and has a trading volume of 18.368 billion USD.

We can see a decrease of 12.89% in the total trading volume in the last 24 hrs which appears to be normal.

The Week Ahead

On the upside the next visible targets are 1655 which is a 38.2% retracement from 4-week low, and 1726 which is a 50% retracement from 4-week high/low.

The price of Ethereum is now testing its immediate resistance zone located at $1700 and we are likely to witness a rally in the price once it touches these levels.

The immediate short-term outlook for Ether has turned strongly BULLISH, the medium-term outlook has turned NEUTRAL, and the long-term outlook for Ether is NEUTRAL in present market conditions.

The prices of ETHUSD will need to remain above the important support level of $1500 this week.

The weekly outlook is projected at $1800 with a consolidation zone of $1700.

Technical Indicators:

The relative strength index (14): is at 58.32 indicating a BUY

The moving averages convergence divergence (12,26): is at 10.23 indicating a BUY

The rate of price change: is at 3.32 indicating a BUY

The ultimate Oscillator: is at 58.98 indicating a BUY

VIEW FULL ANALYSIS VISIT - FXOpen Blog...

Disclaimer: CFDs are complex instruments and come with a high risk of losing your money.
 

FXOpen Trader

Active Member
Jul 2, 2022
385
4
Watch FXOpen's September 5 - 9 Weekly Digest Video

In this video, FXOpen UK COO Gary Thomson sums up the week’s happenings and discusses the most significant news reports.

  • British Pound at 20 year low as new Prime Minister takes office
  • New extreme for the yen
  • Has Apple's presentation affected the stock price?
  • Stark reality of China's lockdowns: Oil and FTSE 100 down

Watch our short and informative video, and stay updated with FXOpen.


FXOpen YouTube
 

FXOpen Trader

Active Member
Jul 2, 2022
385
4
GBP/USD Recovers, EUR/GBP Eyes More Upsides


GBP/USD started a fresh increase above the 1.1550 zone. EUR/GBP is rising and might climb further higher above the 0.8700 resistance.

Important Takeaways for GBP/USD and EUR/GBP

  • The British Pound started a fresh recovery wave above the 1.1550 resistance zone against the US Dollar.
  • There is a key bullish trend line forming with support near 1.1585 on the hourly chart of GBP/USD.
  • EUR/GBP climbed higher above the 0.8620 and 0.8650 resistance levels.
  • There is a major bullish trend line forming with support near 0.8665 on the hourly chart.

GBP/USD Technical Analysis

The British Pound found support near the 1.1420 zone against the US Dollar. The GBP/USD pair started a recovery wave and was able to clear the 1.1500 resistance zone.

There was a decent increase above the 1.1550 level and the 50 hourly simple moving average. The pair even climbed above the 1.1600 level. A high was formed near 1.1641 on FXOpen and the pair is now correcting gains.

GBP/USD Hourly Chart


There was a move below the 1.1620 level. The pair declined below the 23.6% Fib retracement level of the upward move from the 1.1550 swing low to 1.1641 high.

On the downside, an initial support is near the 1.1600 level. It is near the 50% Fib retracement level of the upward move from the 1.1550 swing low to 1.1641 high. There is also a key bullish trend line forming with support near 1.1585 on the hourly chart of GBP/USD.

The next major support is near the 1.1550 level. Any more losses could lead the pair towards the 1.1500 support zone or even 1.1420.

On the upside, an initial resistance is near the 1.1640 level. The next main resistance is near the 1.1650 zone. A clear upside break above the 1.1640 and 1.1650 resistance levels could open the doors for a steady increase in the near term. The next major resistance sits near the 1.1715 level.

VIEW FULL ANALYSIS VISIT - FXOpen Blog...
 

FXOpen Trader

Active Member
Jul 2, 2022
385
4
BTCUSD and XRPUSD Technical Analysis – 13th SEP 2022


BTCUSD: Inverted Hammer Pattern Above $19025

Bitcoin was unable to sustain its bearish momentum and after touching a low of 18567 on 07th Sep, it started to correct upwards crossing the $22000 handle today in the European trading session.

The price of Bitcoin continues to correct upwards due to the increased buying pressure and more upsides are expected towards the $25000 levels.

We can see a bullish price crossover with the adaptive moving average AMA50 in the 15-minute time frame.

We have also seen a bullish opening gap underpinning the markets this week.

We can clearly see an inverted hammer pattern above the $19025 handle which is a bullish reversal pattern because it signifies the end of a downtrend and a shift towards an uptrend.

Bitcoin touched an intraday low of 22067 in the Asian trading session and an intraday high of 22553 in the European trading session today.

Both the STOCH and Williams percent range are indicating overbought levels which means that in the immediate short term a decline in the prices is expected.

The relative strength index is at 71 indicating a very strong demand for bitcoin at the current market levels and the continuation of the buying pressure in the markets.

Bitcoin is now moving above its 100 hourly simple moving average and below its 200 hourly exponential moving averages.

All of the major technical Indicators are giving a STRONG BUY signal, which means that in the immediate short term we are expecting targets of 24000 and 25000.

The average true range is indicating LESS market volatility with a strong bullish momentum.

  • Bitcoin: bullish reversal seen above $19025.
  • STOCHRSI is indicating an oversold level.
  • The price is now trading just above its pivot level of $22332.
  • All of the moving averages are giving a STRONG BUY market signal.

Bitcoin: Bullish reversal seen above $19025


The price of bitcoin is forming an ascending channel, with the current price action indicating a move towards the consolidation phase above the $22000 handle.

We can see the formation of a bullish harami pattern in the 2-hourly time-frame indicating the underlying bullish nature of the markets.

We have also detected the formation of a bullish engulfing line in the 1-hourly time frame indicating the bullish scenario.

The immediate short-term outlook for bitcoin is bullish, the medium-term outlook has turned neutral, and the long-term outlook remains neutral under present market conditions.

Bitcoin’s support zone is located at $21000 and the price continues to remain above these levels for the continuation of the bullish reversal in the markets.

The price of BTCUSD is now facing its classic resistance level of 22502 and Fibonacci resistance level of 22731 after which the path towards 23000 will get cleared.

In the last 24hrs BTCUSD has increased by 0.95% by 211$ and has a 24hr trading volume of USD 43.846 billion. We can see a decrease of 2.98% in the trading volume as compared to yesterday, which appears to be normal.

The Week Ahead

The price of bitcoin is moving in a consolidation zone above the $22000 levels. At present the price is moving into a narrow range between the 22000 and 22500 levels.

We can see that the price of bitcoin is super bullish and we are heading towards the $30000 handle in the medium term range.

The daily RSI is printing at 61 which indicates a very strong demand from the long-term investors.

The price of BTCUSD will need to remain above the important support levels of $21000 this week.

The weekly outlook is projected at $25000 with a consolidation zone of $24500.

Technical Indicators:

The moving averages convergence divergence (12, 26): is at 564.30 indicating a BUY.

The ultimate oscillator: is at 57.64 indicating a BUY.

The rate of price change: is at 5.34 indicating a BUY.

The commodity channel index (14): is at 105.75 indicating a BUY.

VIEW FULL ANALYSIS VISIT - FXOpen Blog...
 

FXOpen Trader

Active Member
Jul 2, 2022
385
4
EUR/USD Trims Gains, USD/JPY Aims New High


EUR/USD started another decline from the 1.0200 resistance. USD/JPY is rising and might soon clear the key 145.00 resistance zone.

Important Takeaways for EUR/USD and USD/JPY

  • The Euro started a fresh decline and even traded below the 1.0020 support.
  • There was a break below a major bullish trend line with support near 1.0140 on the hourly chart of EUR/USD.
  • USD/JPY started a fresh increase after it remained well bid above the 141.50 support.
  • There is a key bullish trend line forming with support near 142.30 on the hourly chart.

EUR/USD Technical Analysis

This past week, the Euro was able to recover above the 1.0100 level against the US Dollar. The EUR/USD pair even broke the 1.0150 level, but the bears were active near the 1.0200 zone.

A high was formed near 1.0197 on FXOpen and the pair started a fresh decline. There was a clear move below the 1.0150 and 1.0120 support levels. The pair declined below the 50% Fib retracement level of the upward move from the 0.9864 swing low to 1.0197 high.

EUR/USD Hourly Chart


Besides, there was a break below a major bullish trend line with support near 1.0140 on the hourly chart of EUR/USD. The pair is now trading below the 1.0050 level and the 50 hourly simple moving average.

An immediate resistance on the upside is near the 1.0000 level. The next major resistance is near the 1.0030 level. An upside break above 1.0030 could set the pace for a steady increase. In the stated case, the pair might revisit 1.0080.

Any more gains might send the pair towards 1.0120. If not, the pair might drop and test the 0.9950 support. The next major support is near 0.9920, below which the pair could drop to 0.9860 in the near term.

VIEW FULL ANALYSIS VISIT - FXOpen Blog...
 

FXOpen Trader

Active Member
Jul 2, 2022
385
4
ETHUSD and LTCUSD Technical Analysis – 15th SEP, 2022


ETHUSD: Hammer Pattern Above $1551

Ethereum was unable to sustain its bullish momentum and after touching a high of 1788 on 11th Sep the price started to decline against the US dollar. This decline was mainly attributed to the strength of the US dollar in the global markets and the subsequent increase in the market liquidity.

We can see a continued buying pressure since yesterday and the formation of a bullish price crossover pattern with moving averages MA20, MA50 and MA100 in the 15-minute time frame.

We can clearly see a hammer pattern above the $1551 handle which is a bullish pattern and signifies the end of a bearish phase and the start of a bullish phase in the markets.

ETH is now trading just above its pivot level of 1599 and moving in a strong bullish channel. The price of ETHUSD is now testing its classic resistance level of 1625 and Fibonacci resistance level of 1651 after which the path towards 1700 will get cleared.

The relative strength index is at 56 indicating a STRONGER demand for Ether and the continuation of the uptrend in the markets.

We can see that the super trend indicator is giving a bullish reversal signal in the 15-minute time frame.

We have also detected a bullish harami cross pattern in the 1 -hour time frame.

The STOCHRSI is indicating an OVERBOUGHT market, which means that the prices are expected to decline in the short-term range.

Most of the technical indicators are giving a STRONG BUY market signal.

Most of the moving averages are giving a BUY signal and we are now looking at the levels of $1750 to $1900 in the short-term range.

ETH is now trading below both the 100 & 200 hourly simple and exponential moving averages.

  • Ether: bullish reversal seen above the $1551 mark
  • Short-term range appears to be strongly BULLISH
  • ETH continues to remain above the $1600 level
  • The average true range is indicating HIGH market volatility

Ether: Bullish Reversal Seen Above $1551


ETHUSD is now moving into a strongly bullish channel with the prices trading above the $1600 handle in the European trading session today.

ETH touched an intraday low of 1571 and an intraday high of 1651 in the European trading session today.

We have seen a bullish opening of the markets today indicating the underlying bullish nature of the markets.

We can see that MACD has crossed UP its moving average in the 4-hour time frame indicating the bullish tone, and now we are looking at the levels of 1800 to 2000 in the medium-term range.

The daily RSI is printing at 48 indicating a neutral demand in the long-term range.

The key support levels to watch are $1566 and $1501 and the prices of ETHUSD need to remain above these levels for the continuation of the bullish reversal in the markets.

ETH has increased by 1.40% with a price change of 22.33$ in the past 24hrs and has a trading volume of 24.474 billion USD.

We can see an increase of 5.50% in the total trading volume in the last 24 hrs which appears to be normal.

The Week Ahead

On the upside, the next visible targets are 1752 which is a 38.2% retracement from 4 week low, and 1690 which is a 50% retracement from 4 week high/low.

The prices of Ethereum are now testing its immediate resistance zone located at $1700 and we are likely to witness a rally in the prices once it touches these levels.

The immediate short-term outlook for Ether has turned strongly BULLISH, the medium-term outlook has turned NEUTRAL, and the long-term outlook for Ether is NEUTRAL in present market conditions.

The price of ETHUSD will need to remain above the important support level of $1500 this week.

The weekly outlook is projected at $1900 with a consolidation zone of $1700.

Technical Indicators:

The average directional change (14): is at 24.06 indicating a BUY

The moving averages convergence divergence (12,26): is at 0.48 indicating a BUY

The rate of price change: is at 2.61 indicating a BUY

The ultimate oscillator: is at 62.47 indicating a BUY

VIEW FULL ANALYSIS VISIT - FXOpen Blog...

Disclaimer: CFDs are complex instruments and come with a high risk of losing your money.
 

FXOpen Trader

Active Member
Jul 2, 2022
385
4
Gold Price and Crude Oil Price At Risk of More Losses


Gold price started a fresh decline below the $1,685 support zone. Crude oil price is also struggling and remains at a risk of more losses.

Important Takeaways for Gold and Oil

  1. Gold price started a fresh decline after it failed to stay above $1,700 against the US Dollar.
  2. There is a key bearish trend line forming with resistance near $1,675 on the hourly chart of gold.
  3. Crude oil price also started a steady decline from the $90.00 zone.
  4. There was a break below a major bullish trend line with support near $87.50 on the hourly chart of XTI/USD.

Gold Price Technical Analysis

Gold price attempted to gain pace above the $1,735 level against the US Dollar. However, the price failed to stay above $1,720 and started a fresh decline.

There was a clear move below the $1,700 support zone and the 50 hourly simple moving average. The price declined below the $1,675 level to move into a bearish zone. The decline gained pace below the $1,670 level.

Gold Price Hourly Chart


The price traded as low as $1,660 and is currently consolidating losses. On the upside, the price is facing resistance near the $1,670 level.

The first major resistance is near the $1,675 level. There is also a key bearish trend line forming with resistance near $1,675 on the hourly chart of gold. The trend line is near the 23.6% Fib retracement level of the recent decline from the $1,735 swing high to $1,660 low.

The main resistance is now forming near the $1,688 level and the 50 hourly simple moving average, above which it could even test the 50% Fib retracement level of the recent decline from the $1,735 swing high to $1,660 low.

A clear upside break above the $1,700 resistance could send the price towards $1,735. An immediate support on the downside is near the $1,660 level. The next major support is near the $1,650 level, below which there is a risk of a larger decline. In the stated case, the price could decline sharply towards the $1,620 support zone.

VIEW FULL ANALYSIS VISIT - FXOpen Blog...

Disclaimer: CFDs are complex instruments and come with a high risk of losing your money.
 

FXOpen Trader

Active Member
Jul 2, 2022
385
4
BTCUSD and XRPUSD Technical Analysis – 20th SEP 2022


BTCUSD: Bullish Engulfing Pattern Above $18293

Bitcoin was unable to sustain its bearish momentum and after touching a low of 18322 on 19th Sep, it has entered into a consolidation channel above the $19000 handle today in the European trading session.

The price of bitcoin continues to move in a tight range between 19200 and 19700 levels today suggesting that we have hit the bottom of the downtrend.

We can see the formation of an ascending channel pattern on the hourly chart of the BTCUSD.

The price of bitcoin is nearing the horizontal support level in the daily time frame indicating the bullish tone in the markets.

We can clearly see a bullish engulfing pattern above the $18293 handle which is a bullish reversal pattern because it signifies the end of a downtrend and a shift towards an uptrend.

Bitcoin touched an intraday high of 19679 in the Asian trading session and an intraday low of 19195 in the European trading session today.

Both the STOCH and Williams percent range are indicating overbought levels which means that in the immediate short term a decline in the prices is expected.

The relative strength index is at 53 indicating a NEUTRAL demand for bitcoin at the current market levels and the continuation of the buying pressure in the markets.

Bitcoin is now moving below its 100 hourly simple moving average and below its 200 hourly exponential moving averages.

Some of the major technical indicators are giving a BUY signal, which means that in the immediate short term, we are expecting targets of 20000 and 21500.

The average true range is indicating LESS market volatility with a mild bullish momentum.

  • Bitcoin: bullish reversal seen above $18293
  • The commodity channel index is indicating a neutral level
  • The price is now trading just above its pivot level of $19399
  • Some of the moving averages are giving a BUY market signal

Bitcoin: Bullish Reversal Seen Above $18293


The price of bitcoin has crashed below the important support level of $19000 due to the strength of the US dollar and the increase in the global market liquidity pattern.

The adaptive moving average AMA50 and moving average MA20 is giving a bullish trend reversal signal in the 15-minutes time frame.

We can see that the momentum indicator is giving a bullish trend signal in the weekly time frame.

We have also detected a bullish opening of the markets indicating the underlying bullish sentiment.

The immediate short-term outlook for bitcoin is bullish, the medium-term outlook has turned neutral, and the long-term outlook remains neutral under present market conditions.

Bitcoin’s support zone is located at $18000 and the prices continue to remain above these levels for the continuation of the bullish reversal in the markets.

The price of BTCUSD is now facing its сlassic resistance level of 19544 and Fibonacci resistance level of 19722 after which the path towards 20000 will get cleared.

In the last 24hrs BTCUSD has increased by 4.77% by 881$ and has a 24hr trading volume of USD 36.188 billion. We can see an increase of 6.47% in the trading volume compared to yesterday, which appears to be normal.

The Week Ahead

The price of bitcoin is moving in a consolidation zone above the $19000 level. At present the price of bitcoin is gaining a bullish traction against the US dollar in the medium-term range.

We can see the buildup of positive momentum in the markets with the prices moving close to the psychological support level of $20000.

The daily RSI is printing at 40 which indicates a weak demand from the long-term investors.

The price of BTCUSD will need to remain above the important support level of $18500 this week.

The weekly outlook is projected at $21000 with a consolidation zone of $20000.

Technical Indicators:

The moving averages convergence divergence (12,26): is at 5.20 indicating a BUY

The ultimate oscillator: is at 51.34 indicating a BUY

The rate of price change: is at 0.70 indicating a BUY

The average directional change (14): is at 28.61 indicating a BUY

VIEW FULL ANALYSIS VISIT - FXOpen Blog...

Disclaimer: CFDs are complex instruments and come with a high risk of losing your money.
 

FXOpen Trader

Active Member
Jul 2, 2022
385
4
ETHUSD and LTCUSD Technical Analysis – 22nd SEP, 2022


ETHUSD: Hammer Pattern Above $1220

Ethereum was unable to sustain its bullish momentum and after touching a high of 1393 on 21st Sep the prices started to decline against the US dollar. The prices of Ethereum touched a low of 1220 on 22nd Sep after which we can see a bounce upwards.

We can see a continued buying pressure today and we can see the formation of a bullish harami cross pattern in the 15-minutes time frame.

We can clearly see a hammer pattern above the $1220 handle which is a bullish pattern and signifies the end of a bearish phase and the start of a bullish phase in the markets.

ETH is now trading just above its pivot level of 1288 and is moving into a strong bullish channel. The price of ETHUSD is now testing its classic resistance level of 1298 and Fibonacci resistance level of 1308 after which the path towards 1400 will get cleared.

The relative strength index is at 47 indicating a NEUTRAL demand for Ether and a shift towards a consolidation phase in the markets.

We can see that the adaptive moving average AMA50 and MA50 both are giving a bullish trend reversal signal in the markets.

The STOCHRSI is indicating an OVERBOUGHT market, which means that the prices are expected to decline in the short-term range.

Most of the technical indicators are giving a STRONG BUY market signal.

Some of the moving averages are giving a BUY signal and we are now looking at the levels of $1400 to $1500 in the short-term range.

ETH is now trading below both the 100 & 200 hourly simple and exponential moving averages.

  • Ether: bullish reversal seen above the $1220 mark
  • Short-term range appears to be mildly BULLISH
  • ETH continues to remain above the $1200 level
  • The average true range is indicating LESS market volatility

Ether: Bullish Reversal Seen Above $1220


ETHUSD is now moving into a mildly bullish channel with the prices trading above the $1250 handle in the European trading session today.

ETH touched an intraday low of 1220 in the Asian trading session and an intraday high of 1297 in the European trading session today.

We have seen that the prices are near support of the channel indicating a bullish scenario.

The moving average MA100 is also indicating the bullish tone in the daily timeframe and now we are looking at the levels of 1500 to 1600 in the medium-term range.

The daily RSI is printing at 35 indicating a neutral demand in the long-term range.

The key support levels to watch are $1200 and $1258, and the prices of ETHUSD need to remain above these levels for the continuation of the bullish reversal in the markets.

ETH has decreased by 3.54% with a price change of 47.38$ in the past 24hrs and has a trading volume of 22.404 billion USD.

We can see an increase of 61.35% in the total trading volume in the last 24 hrs which is due to the heavy buying seen at lower levels by the medium-term investors.

The Week Ahead

The prices have been ranging into an oversold zone from last week and an upwards correction is expected. We are now looking for a sharp rally into the markets towards the $1600 levels.

The recent fall in the levels of Ethereum is attributed to the Federal Reserve which hiked the key interest rates for the third time this year.

The immediate short-term outlook for Ether has turned mildly BULLISH, the medium-term outlook has turned BULLISH, and the long-term outlook for Ether is NEUTRAL in present market conditions.

The prices of ETHUSD will need to remain above the important support level of $1200 this week.

The weekly outlook is projected at $1500 with a consolidation zone of $1400.

Technical Indicators:

The average directional change (14): is at 16.88 indicating a NEUTRAL level

The Williams percent range: is at -36.05 indicating a BUY

The bull/bear power (13): is at 12.62 indicating a BUY

The ultimate oscillator: is at 52.57 indicating a BUY

VIEW FULL ANALYSIS VISIT - FXOpen Blog...

Disclaimer: CFDs are complex instruments and come with a high risk of losing your money.
 

FXOpen Trader

Active Member
Jul 2, 2022
385
4
Watch FXOpen's September 19 - 23 Weekly Digest Video

In this video, FXOpen UK COO Gary Thomson sums up the week’s happenings and discusses the most significant news reports.

  • The British pound hits 37-year low against US dollar
  • How mobilization in Russia will affect financial markets
  • US stock market complacency on the bankers' radar
  • After a long period of hardship, the Japanese yen is back on track

Watch our short and informative video, and stay updated with FXOpen.


VIEW FULL NEWS VISIT - FXOpen Company News...

Disclaimer: CFDs are complex instruments and come with a high risk of losing your money.
 

FXOpen Trader

Active Member
Jul 2, 2022
385
4
BTCUSD and XRPUSD Technical Analysis – 27th SEP 2022


BTCUSD: Double Bottom Pattern Above $18566

Bitcoin was unable to sustain its bearish momentum and after touching a low of 18279 on 21st Sep, the price has continued to escalate upwards and crossed the $20000 handle today in the European trading session.

This upside break was long overdue and now marks the beginning of rebound towards the $25000 level.

We can see the formation of bullish engulfing lines in the 15-minute and weekly time frames.

The momentum indicator is back over zero indicating a bullish scenario in both the 30-minute and daily time frames.

We can clearly see a double bottom pattern above the $18566 handle which is a bullish reversal pattern because it signifies the end of a downtrend and a shift towards an uptrend.

Bitcoin touched an intraday low of 19097 in the Asian trading session and an intraday high of 20310 in the European trading session today.

Both the STOCH and STOCHRSI are indicating overbought levels which means that in the immediate short term, a decline in the prices is expected.

The relative strength index is at 75 indicating an OVERBOUGHT market, and the possibility of some downwards correction due to profit taking by the medium-term investors.

Bitcoin is now moving above its 100 hourly simple moving average and below its 200 hourly exponential moving averages.

Most of the major technical indicators are giving a STRONG BUY signal, which means that in the immediate short term, we are expecting targets of 22000 and 23500.

The average true range is indicating LESS market volatility with a strong bullish momentum.

  • Bitcoin: bullish reversal seen above $18566.
  • The Williams percent range is indicating an overbought level.
  • The price is now trading just above its pivot level of $20179.
  • All of the moving averages are giving a STRONG BUY market signal.

Bitcoin: Bullish Reversal Seen Above $18566


The price of bitcoin continues to rise amid the buying pressure and improved investor sentiments. We are now looking at the important target levels of $22000 and $25000 in the medium-term ranges.

The adaptive moving averages AMA20 and AMA50 are both giving a bullish trend reversal signal in the 15-minute and daily timeframes.

We can see the formation of a bullish harami pattern in the 2-hour time frame.

We have also detected a bullish opening of the markets indicating the underlying bullish sentiment.

The immediate short-term outlook for bitcoin is bullish, the medium-term outlook has turned bullish, and the long-term outlook remains neutral under present market conditions.

Bitcoin’s support zone is located at $19000, and the price continues to remain above these levels for the continuation of the bullish reversal in the markets.

The price of BTCUSD is now facing its classic resistance level of 20253 and Fibonacci resistance level of 20298 after which the path towards 22000 will get cleared.

In the last 24hrs, BTCUSD has increased by 5.87% by 1120$ and has a 24hr trading volume of USD 48.845 billion. We can see an increase of 46.08% in the trading volume compared to yesterday, due to global buying pressure by the long-term investors.

The Week Ahead

The price of bitcoin is moving in a consolidation zone above the $20000 level. Further upsides are projected at $21000 and $22500 as the immediate targets.

The price of bitcoin reached its peak value of $69000 last year the month of November, and at the present level of $20000, we still need to recover ground towards the $40000 level, which if reached will mark a gain of 100% from the present market level.

The history of bitcoin price action shows that it is capable of doing so, and has done in the past.

The daily RSI is printing at 52 which indicates a neutral level and a move towards the consolidation phase in the markets.

The prices of BTCUSD will need to remain above the important support level of $19000 this week.

The weekly outlook is projected at $22000 with a consolidation zone of $21500.

Technical Indicators:

The moving averages convergence divergence (12,26): is at 323.90 indicating a BUY

The ultimate oscillator: is at 62.28 indicating a BUY

The rate of price change: is at 5.93 indicating a BUY

The average directional change (14): is at 51.06 indicating a BUY

VIEW FULL ANALYSIS VISIT - FXOpen Blog...

Disclaimer: CFDs are complex instruments and come with a high risk of losing your money.
 

FXOpen Trader

Active Member
Jul 2, 2022
385
4
ETHUSD and LTCUSD Technical Analysis – 29th SEP, 2022


ETHUSD: Bullish Engulfing Pattern Above $1257

Ethereum was unable to sustain its bullish momentum and after touching a high of 1400 on 27th Sep the price started to decline against the US dollar. The price of Ethereum touched a low of 1266 on 28th Sep after which we can see a bounce upwards.

We can see a continued buying pressure today and the formation of a bullish engulfing line in the 2-hour time frame.

We can clearly see a bullish engulfing pattern above the $1257 handle which is a bullish pattern and signifies the end of a bearish phase and the start of a bullish phase in the markets.

ETH is now trading just above its pivot level of 1321 and moving into a strong bullish channel. The price of ETHUSD is now testing its сlassic resistance level of 1327 and Fibonacci resistance level of 1331 after which the path towards 1400 will get cleared.

The relative strength index is at 53 indicating a NEUTRAL demand for Ether and a shift towards the consolidation phase in the markets.

We can see that the adaptive moving average AMA20, AMA50, and AMA100 are giving a bullish trend reversal signal in the markets.

The STOCHRSI and Williams percent range is indicating a NEUTRAL market, which means that the prices are expected to remain in a consolidation phase in the short-term range.

Some of the technical indicators are giving a STRONG BUY market signal.

Most of the moving averages are giving a BUY signal and we are now looking at the levels of $1400 to $1550 in the short-term range.

ETH is now trading above both its 100 & 200 hourly simple and exponential moving averages.

  • Ether: bullish reversal seen above the $1257 mark
  • The short-term range appears to be mildly BULLISH
  • ETH continues to remain above the $1300 level
  • The average true range is indicating LESS market volatility

Ether: Bullish Reversal Seen Above $1257


ETHUSD is moving in a mildly bullish channel with the price trading above the $1300 handle in the European trading session today.

ETH touched an intraday high of 1351 in the Asian trading session and an intraday low of 1313 in the European trading session today.

We have seen that the ichimoku price is over the cloud in the 1-hour time frame indicating a bullish scenario.

The Bullish harami pattern is observed in the weekly timeframe and MACD indicator is giving a bullish divergence signal in the 4-hour time frame.

The parabolic SAR indicator is giving a bullish reversal signal in the 30-minute time frame and now we are looking at the levels of 1450 to 1500 in the medium-term range.

The daily RSI is printing at 40 indicating a neutral demand in the long-term range.

The key support levels to watch are $1245 and $1285 and the prices of ETHUSD need to remain above these levels for the continuation of the bullish reversal in the markets.

ETH has increased by 4.27% with a price change of 54.65$ in the past 24hrs and has a trading volume of 16.127 billion USD.

We can see a decrease of 13.25% in the total trading volume in the last 24 hrs which is due to the shift towards a consolidation phase in the markets.

The Week Ahead

The price of Ethereum declined due the ongoing strength of the United States dollar and the increase in the market liquidity. We can see that now we are moving into a consolidation zone and the prices tend to move in a narrow range.

We are now looking for a fresh upside wave of correction towards the $1500 and $1600 levels.

We can see the formation of a bullish trendline in place from $1257 towards $1491 level.

The immediate short-term outlook for Ether has turned mildly BULLISH, the medium-term outlook has turned BULLISH, and the long-term outlook for Ether is NEUTRAL in present market conditions.

The prices of ETHUSD will need to remain above the important support level of $1250 this week.

The weekly outlook is projected at $1550 with a consolidation zone of $1500.

Technical Indicators:

The average directional change (14): is at 25.71 indicating a BUY

The rate of price change: is at 0.156 indicating a BUY

The bull/bear power (13): is at 1.606 indicating a BUY

The ultimate oscillator: is at 56.76 indicating a BUY

VIEW FULL ANALYSIS VISIT - FXOpen Blog...

Disclaimer: CFDs are complex instruments and come with a high risk of losing your money.
 

FXOpen Trader

Active Member
Jul 2, 2022
385
4
BTCUSD and XRPUSD Technical Analysis – 04th OCT 2022


BTCUSD: Three White Soldiers Pattern Above $18527

Bitcoin was unable to sustain its bullish momentum and after touching a high of 20328 on 27th Sep, it started to decline touching a low of 18525 on 28th Sep. After this decline, the prices have stabilized and we can see an uptrend in the markets.

The prices have crossed the $20000 mark in the European trading session today.

We can see that the price is back over the pivot point in the weekly time frame.

The price of bitcoin is ranging near the horizontal support levels in the weekly time frame.

We can clearly see a three white soldiers pattern above the $18527 handle which is a bullish reversal pattern because it signifies the end of a downtrend and a shift towards an uptrend.

Bitcoin touched an intraday low of 19510 in the Asian trading session and an intraday high of 20099 in the European trading session today.

Both the STOCH and STOCHRSI are indicating overbought levels which means that in the immediate short term a decline in the prices is expected.

The relative strength index is at 74 indicating a STRONG demand for bitcoin, and the continuation of the buying pressure in the markets.

Bitcoin is now moving above its 100 hourly simple moving average and above its 200 hourly exponential moving averages.

Most of the major technical indicators are giving a STRONG BUY signal, which means that in the immediate short term we are expecting targets of 21000 and 22500.

The average true range is indicating LESS market volatility with a strong bullish momentum.

  • Bitcoin: bullish reversal seen above $18527
  • The Williams percent range is indicating an overbought level
  • The price is now trading just above its pivot level of $19931
  • All of the moving averages are giving a STRONG BUY market signal

Bitcoin: Bullish Reversal Seen Above $18527


The strong bullish rebound that is seen is expected to continue in the short-term range and now we are looking at $21000 and $22000 as the immediate targets.

The adaptive moving average AMA20 is giving a bullish crossover pattern in the daily timeframe.

The parabolic SAR indicator is giving a bullish reversal signal on the daily time frame.

We have also detected the ichimoku bullish crossover pattern on the 4-hour time frame.

The immediate short-term outlook for bitcoin is bullish, the medium-term outlook has turned bullish, and the long-term outlook remains neutral under present market conditions.

Bitcoin’s support zone is located at $19005 and the prices continue to remain above this level for the continuation of the bullish reversal in the markets.

The price of BTCUSD is now facing its classic resistance level of 20007 and Fibonacci resistance level of 200048 after which the path towards 21000 will get cleared.

In the last 24hrs, BTCUSD has increased by 3.80% by 730$, and has a 24hr trading volume of USD 31.762 billion. We can see an increase of 28.33% in the trading volume as compared to yesterday, due to increased demand for bitcoin globally.

The Week Ahead

The prices of bitcoin are moving in a bullish zone above the $19900 level. Further upsides are projected at $21000 and $22000 as the immediate targets.

We have seen continued buying pressure at lower levels, as we can see the formation of an ascending price channel from $18527 towards the $20214 levels.

The daily RSI is printing at 52 which indicates a neutral level and a move towards the consolidation phase in the markets.

The price of BTCUSD will need to remain above the important support level of $19000 this week.

The weekly outlook is projected at $21000 with a consolidation zone of $20500.

Technical Indicators:

The moving averages convergence divergence (12,26): is at 142.70 indicating a BUY

The ultimate oscillator: is at 60.39 indicating a BUY

The rate of price change: is at 1.75 indicating a BUY

The average directional change (14): is at 52.40 indicating a BUY

VIEW FULL ANALYSIS VISIT - FXOpen Blog...

Disclaimer: CFDs are complex instruments and come with a high risk of losing your money.
 

FXOpen Trader

Active Member
Jul 2, 2022
385
4
Watch FXOpen's October 3-7 Weekly Digest Video

In this video, FXOpen UK COO Gary Thomson sums up the week’s happenings and discusses the most significant news reports.

  • GBP/USD eyes steady recovery, EUR/GBP faces hurdle
  • Dollar bounces back after record fall
  • Oil is getting more expensive. What's next?
  • Twitter and Tesla volatility as Elon Musk dumps stock to fund his purchase

Watch our short and informative video, and stay updated with FXOpen.


FXOpen YouTube

Disclaimer: CFDs are complex instruments and come with a high risk of losing your money.
 

FXOpen Trader

Active Member
Jul 2, 2022
385
4
BTCUSD and XRPUSD Technical Analysis – 11th OCT 2022


BTCUSD: Triple Top Pattern Below $20441

Bitcoin was unable to sustain its bullish momentum and after touching a high of 20441 on 06th Oct, it started to decline touching a low of 18977 today in the early Asian trading session.

The prices of bitcoin continue to decline amid the selling pressure that is seen across the cryptocurrency markets globally.

We can see that the prices are ranging near a new record low of 1 month in the weekly time frame.

We can clearly see a triple top pattern below the $20441 handle which is a bearish reversal pattern because it signifies the end of an uptrend and a shift towards a downtrend.

Bitcoin touched an intraday high of 19282 and an intraday low of 18960 in the Asian trading session today.

Both the STOCH and STOCHRSI are indicating overbought levels which means that in the immediate short term, a decline in the prices is expected.

The relative strength index is at 43 indicating a WEAK demand for bitcoin, and the continuation of the selling pressure in the markets.

Bitcoin is now moving below its 100 hourly simple moving average and above its 200 hourly exponential moving averages.

Some of the major technical indicators are giving a SELL signal, which means that in the immediate short term, we are expecting targets of 18500 and 18000.

The average true range is indicating LESS market volatility with a mild bearish momentum.

  • Bitcoin: bearish reversal seen below $20441
  • The Williams percent range is indicating an overbought level
  • The price is now trading just below its pivot level of $19107
  • Some of the moving averages are giving a SELL market signal

Bitcoin: Bearish Reversal Seen Below $20441


The fall in the price of bitcoin is in line with the three failed attempts at breaching the $20500 resistance level. We are now heading towards the important support level of $19000 which if broken will pave the way towards $18000.

We can see the formation of a bearish harami and bearish harami cross pattern in the 15-minute time frame.

The commodity channel index is giving a neutral level and the relative strength index is approaching the 50 level.

The immediate short-term outlook for bitcoin is mildly bearish, the medium-term outlook has turned neutral, and the long-term outlook remains neutral under present market conditions.

Bitcoin’s support zone is located at $18656 and the prices need to remain above this level for a potential bullish reversal in the markets.

The price of BTCUSD is now facing its classic support level of 19028 and Fibonacci support level of 19087 after which the path towards 18500 will get cleared.

In the last 24hrs BTCUSD has decreased by 0.92% by 176$ and has a 24hr trading volume of USD 28.521 billion. We can see an increase of 45.40% in the trading volume compared to yesterday, due to increased selling pressure in the markets.

The Week Ahead

The price of bitcoin is moving in a mildly bearish zone below the $19500 level. Further downsides are projected at $18500 and $18000 as the immediate targets.

After the recent decline, bitcoin is staging for a recovery once it breaches down the important support level of $19000.

The average direction index and MA5, MA10 are indicating a bullish rebound in the price towards the $20000 level.

The daily RSI is printing at 43 which indicates a neutral level and a move towards the consolidation phase in the markets.

The price of BTCUSD will need to remain above the important support level of $18500 this week.

The weekly outlook is projected at $19000 with a consolidation zone of $18800.

Technical Indicators:

The moving averages convergence divergence (12,26): is at -75.50 indicating a SELL

The ultimate oscillator: is at 44.42 indicating a SELL

The rate of price change: is at -0.661 indicating a SELL

Bull/Bear power (13): is at -10.73 indicating a SELL

VIEW FULL ANALYSIS VISIT - FXOpen Blog...

Disclaimer: CFDs are complex instruments and come with a high risk of losing your money.
 

FXOpen Trader

Active Member
Jul 2, 2022
385
4
ETHUSD and LTCUSD Technical Analysis – 13th OCT, 2022


ETHUSD: Evening Star Pattern Below $1337

Ethereum was unable to sustain its bullish momentum and after touching a high of 1381 on 06th Oct, the prices started to decline against the US dollar. The prices of Ethereum touched a low of 1267 on 11th Oct after which we can see a shift towards the consolidation phase in the markets.

We have seen a bearish opening of the markets which indicates the bearish trend.

We can clearly see an evening star pattern below the $1337 handle which is a bearish pattern and signifies the end of a bullish phase and the start of a bearish phase in the markets.

ETH is now trading just below its pivot level of 1277 and is moving in a mildly bearish channel. The price of ETHUSD is now testing its classic support level of 1268 and Fibonacci support level of 1275 after which the path towards 1200 will get cleared.

The relative strength index is at 36 indicating a weaker demand for Ether and a shift towards the consolidation phase in the markets.

We can see that the price is back under the pivot point in the daily time frame indicating a bearish trend.

Both the STOCHRSI and the Williams percent range are indicating an oversold market, which means that the prices are expected to correct upwards in the short-term range.

Most of the technical indicators are giving a STRONG SELL market signal.

All of the moving averages are giving a STRONG SELL signal and we are now looking at the levels of $12500 to $1200 in the short-term range.

ETH is now trading below both the 100 & 200 hourly simple and exponential moving averages.

  • Ether: bearish reversal seen below the $1337 mark
  • The short-term range appears to be mildly bearish
  • ETH continues to remain below the $1300 level
  • The average true range is indicating LESS market volatility

Ether: Bearish Reversal Seen Below $1337


ETHUSD is now moving in a mildly bearish channel with the price trading below the $1300 handle in the European trading session today.

ETH touched an intraday high of 1302 in the Asian trading session and an intraday low of 1272 in the European trading session today.

We can see the formation of a bearish harami pattern in the weekly time frame.

The moving average MA50 is giving a bearish trend reversal signal in the 1 hourly time frame.

We have seen that the support of the channel is broken in the 15-minute time frame indicating the bearish nature of the markets.

The daily RSI is printing at 38 indicating a weak demand in the long-term range.

The key support levels to watch are $1223 and $1227, and the price of ETHUSD needs to remain above these levels for any potential bullish reversal in the markets.

ETH has decreased by 2.20% with a price change of 28.61$ in the past 24hrs and has a trading volume of 8.806 billion USD.

We can see an increase of 8.11% in the total trading volume in the last 24 hrs which appears to be normal.

The Week Ahead

The price of Ethereum came under heavy selling pressure as it declined below the $1300 level.

Ethereum’s price has now entered a bearish zone against the US dollar and we are now moving towards the $1200 level.

We can see the formation of a major bearish trend line in place from $1337 towards $1265 levels.

The immediate short-term outlook for Ether has turned mildly bearish, the medium-term outlook has turned bearish, and the long-term outlook for Ether is neutral in present market conditions.

The prices of ETHUSD will need to remain above the important support level of $1223 this week.

The weekly outlook is projected at $1275 with a consolidation zone of $1250.

Technical Indicators:

The average directional index ADX (14): is at 26.30 indicating a SELL

The rate of price change: is at -1.61 indicating a SELL

Bull/Bear power (13): is at -16.20 indicating a SELL

The commodity channel index (14): is at -125.57 indicating a SELL

VIEW FULL ANALYSIS VISIT - FXOpen Blog...

Disclaimer: CFDs are complex instruments and come with a high risk of losing your money.
 

FXOpen Trader

Active Member
Jul 2, 2022
385
4
Watch FXOpen's October 10-14 Weekly Digest Video

In this video, FXOpen UK COO Gary Thomson sums up the week’s happenings and discusses the most significant news reports.

  • GBP/USD faces key hurdle, USD/CAD could rise further
  • Professional traders go all out for FX market volatility as volumes soar
  • Traders dump British pound en masse as BoE pulls plug on pension support
  • Yen tests 1998 lows

Watch our short and informative video, and stay updated with FXOpen.


FXOpen YouTube

Disclaimer: CFDs are complex instruments and come with a high risk of losing your money.
 

FXOpen Trader

Active Member
Jul 2, 2022
385
4
BTCUSD and XRPUSD Technical Analysis – 18th OCT 2022


BTCUSD: Bullish Engulfing Pattern Above $18237

Bitcoin was unable to sustain its bearish momentum and after touching a low of 18280 on 13th Oct, it started to correct upwards touching a high of 19893 on 14th Oct.

The price of bitcoin has bounced back from its lows due to heavy buying pressure seen below the $19000 levels.

We can see the formation of an ascending channel pattern above the support level of $19000 on the hourly chart of BTCUSD.

We can clearly see a bullish engulfing pattern above the $18237 handle which is a bullish reversal pattern because it signifies the end of a downtrend and a shift towards an uptrend.

Bitcoin touched an intraday low of 19475 in the Asian trading session and an intraday high of 19694 in the European trading session today.

Both the STOCH and Williams percent range are indicating overbought levels which means that in the immediate short term, a decline in the prices is expected.

The relative strength index is at 56 indicating a STRONG demand for bitcoin, and the continuation of the buying pressure in the markets.

Bitcoin is now moving above its 100 hourly simple moving average and above its 200 hourly exponential moving averages.

Some of the major technical indicators are giving a STRONG BUY signal, which means that in the immediate short term, we are expecting targets of 20500 and 21000.

The average true range is indicating LESS market volatility with a strong bullish momentum.

  • Bitcoin: bullish reversal seen above $18237
  • The STOCHRSI is indicating an oversold level
  • The price is now trading just below its pivot level of $19651
  • Some of the moving averages are giving a BUY market signal

Bitcoin: Bullish Reversal seen Above $18237


The long-term bullish phase has now resumed and the price of bitcoin is expected to become super bullish above the $20000 level.

We can see that any dips below the $19000 level remain well supported. We are now heading towards the important resistance level of $20000 which if broken will pave the way towards $22000.

We can see the formation of a bullish harami pattern in the 30-minute time frame.

The Adaptive Moving Average AMA20 is giving a Bullish signal in the daily timeframe.

The immediate short-term outlook for bitcoin is strongly Bullish, the medium-term outlook has turned bullish, and the long-term outlook remains neutral under present market conditions.

Bitcoin’s support zone is located at $19326 the ichimoku baseline, and the prices need to remain above this level for continuation of bullish reversal in the markets.

The price of BTCUSD is now facing its classic resistance level of 19731 and Fibonacci resistance level of 19785 after which the path towards 20500 will get cleared.

In the last 24hrs, BTCUSD has decreased by 1.36% by 262$ and has a 24hr trading volume of USD 29.008 billion. We can see an increase of 42.42% in the trading volume compared to yesterday, due to increased buying seen in the global crypto markets.

The Week Ahead

The price of bitcoin is moving in a strongly bullish zone above the $19000 level. Further upsides are projected at $20500 and $21000 as the immediate targets.

We can see the formation of bullish engulfing lines in the weekly time frame. The price of bitcoin is back over the pivot point which indicates a bullish scenario in the weekly time frame.

The daily RSI is printing at 50 which indicates a neutral level and a move towards the consolidation phase in the markets.

The prices of BTCUSD will need to remain above the important support level of $19000 this week.

The weekly outlook is projected at $21000 with a consolidation zone of $20500.

Technical Indicators:

The MACD (12,26): is at 96.10 indicating a BUY

The ultimate oscillator: is at 51.65 indicating a BUY

The rate of price change: is at 2.053 indicating a BUY

The bull/bear power (13): is at 366.28 indicating a BUY

VIEW FULL ANALYSIS VISIT - FXOpen Blog...

Disclaimer: CFDs are complex instruments and come with a high risk of losing your money.
 

FXOpen Trader

Active Member
Jul 2, 2022
385
4
ETHUSD and LTCUSD Technical Analysis – 20th OCT, 2022


ETHUSD: Bullish Harami Pattern Above $1263

Ethereum was unable to sustain its bearish momentum and after touching a low of 1205 on 13th Oct, the price started to correct upwards against the US dollar. The price of Ethereum touched a high of 1342 on 14th Oct after which we can see a shift towards the consolidation phase in the markets.

We have seen a bullish opening of the markets which indicates the present bullish trend.

We can clearly see a bullish harami pattern above the $1263 handle which signifies the end of a bearish phase and the start of a bullish phase in the markets.

ETH is now trading just above its pivot level of 1291 and moving into a mildly bullish channel. The price of ETHUSD is now testing its classic resistance level of 1294 and Fibonacci resistance level of 1296 after which the path towards 1300 will get cleared.

The relative strength index is at 47 indicating a neutral demand for Ether and a shift towards consolidation phase in the markets.

We can see that the Williams percent range is back over -50 indicating the bullish tone present in the markets.

The STOCHRSI is indicating an overbought market, which means that the price is expected to decline in the short-term range.

Some of the technical indicators are giving a STRONG BUY market signal.

Some of the moving averages are giving a BUY signal and we are now looking at the levels of $1350 to $1400 in the short-term range.

ETH is now trading below both the 100 & 200 hourly simple and exponential moving averages.

  1. Ether: bullish reversal seen above the $1263 mark
  2. Short-term range appears to be mildly bullish
  3. ETH continues to remain above the $1200 level
  4. The average true range is indicating LESS market volatility

Ether: Bullish Reversal Seen Above $1263


ETHUSD is now moving into a mildly bullish channel with the price trading above the $1200 handle in the European trading session today.

ETH touched an intraday low of 1271 in the Asian trading session and an intraday high of 1294 in the European trading session today.

We can see the formation of a bullish harami pattern in the weekly time frame.

The commodity channel index is indicating a neutral level and fresh upsides are expected in the markets towards the 1300 handle.

Ethereum’s price continues to move into a bullish zone against the US dollar and is expected to move above the $1300 levels.

The daily RSI is printing at 43 indicating a weak demand in the long-term range.

The key support levels to watch are $1232 and $1251, and the price of ETHUSD needs to remain above these levels for the continuation of the bullish reversal in the markets.

ETH has decreased by 0.40% with a price change of 5.16$ in the past 24hrs and has a trading volume of 8.465 billion USD.

We can see a decrease of 15.87% in the total trading volume in the last 24 hrs which appears to be normal.

The Week Ahead

The price of Ethereum continues to remain well supported above the $1200 level, and has now started to move higher aiming at the $1300 level.

We can see the formation of a major bullish trend line in place from $1263 towards $1359 levels.

The immediate short-term outlook for Ether has turned mildly bullish, the medium-term outlook has turned neutral, and the long-term outlook for Ether is neutral in present market conditions.

The price of ETHUSD will need to remain above the important support level of $1273 which is a 38.2% retracement from 4-week low.

The weekly outlook is projected at $1400 with a consolidation zone of $1375.

Technical Indicators:

The average directional index ADX (14): is at 35.00 indicating a BUY

The ultimate oscillator: is at 69.59 indicating a BUY

Bull/bear power (13): is at 3.83 indicating a BUY

The commodity channel index (14): is at 59.91 indicating a BUY

VIEW FULL ANALYSIS VISIT - FXOpen Blog...

Disclaimer: CFDs are complex instruments and come with a high risk of losing your money.
 

FXOpen Trader

Active Member
Jul 2, 2022
385
4
Watch FXOpen's October 17-21 Weekly Market Wrap Video

In this video, FXOpen UK COO Gary Thomson sums up the week’s happenings and discusses the most significant news reports.

  • Semiconductor war between China and the US
  • The US puts pressure on the price of oil
  • UK inflation officially goes over 10%
  • How UK’s political drama is affecting financial markets

Watch our short and informative video, and stay updated with FXOpen.


FXOpen YouTube

Disclaimer: CFDs are complex instruments and come with a high risk of losing your money.